
Data: HFA
Health Facility Assessment (HFA) data captures point-in-time snapshots of facility characteristics - infrastructure, equipment, staffing, and service readiness. Unlike HMIS data which flows continuously from routine reporting, HFA data comes from periodic surveys conducted at specific “time points” (such as “Round 1” or “Baseline December 2024”). This survey-based structure shapes how you import and manage HFA data in FASTR.
What HFA data includes
Section titled “What HFA data includes”HFA surveys collect information about facilities not captured in routine reporting: availability of essential equipment, stock levels of medicines, presence of trained staff, and infrastructure like water and electricity. This data complements HMIS by providing context about facility capacity - helping explain why some facilities perform differently than others.
Required files
Section titled “Required files”Each HFA import requires two files:
- CSV data file - one row per facility with columns for each survey question. The first column should contain facility identifiers matching your registry.
- XLSForm questionnaire file - defines the survey structure following the XLSForm standard. FASTR reads this to extract variable names, question labels, and value labels.
Import workflow
Section titled “Import workflow”Navigate to the Data section and select HFA Data. The sidebar shows an Imports button that opens the imports history and lets you start a new import from within that surface.
The import wizard collects everything needed before any data is sent to the server. Abandoning the wizard at any point has no effect — nothing is stored until you click Start import on the final step.
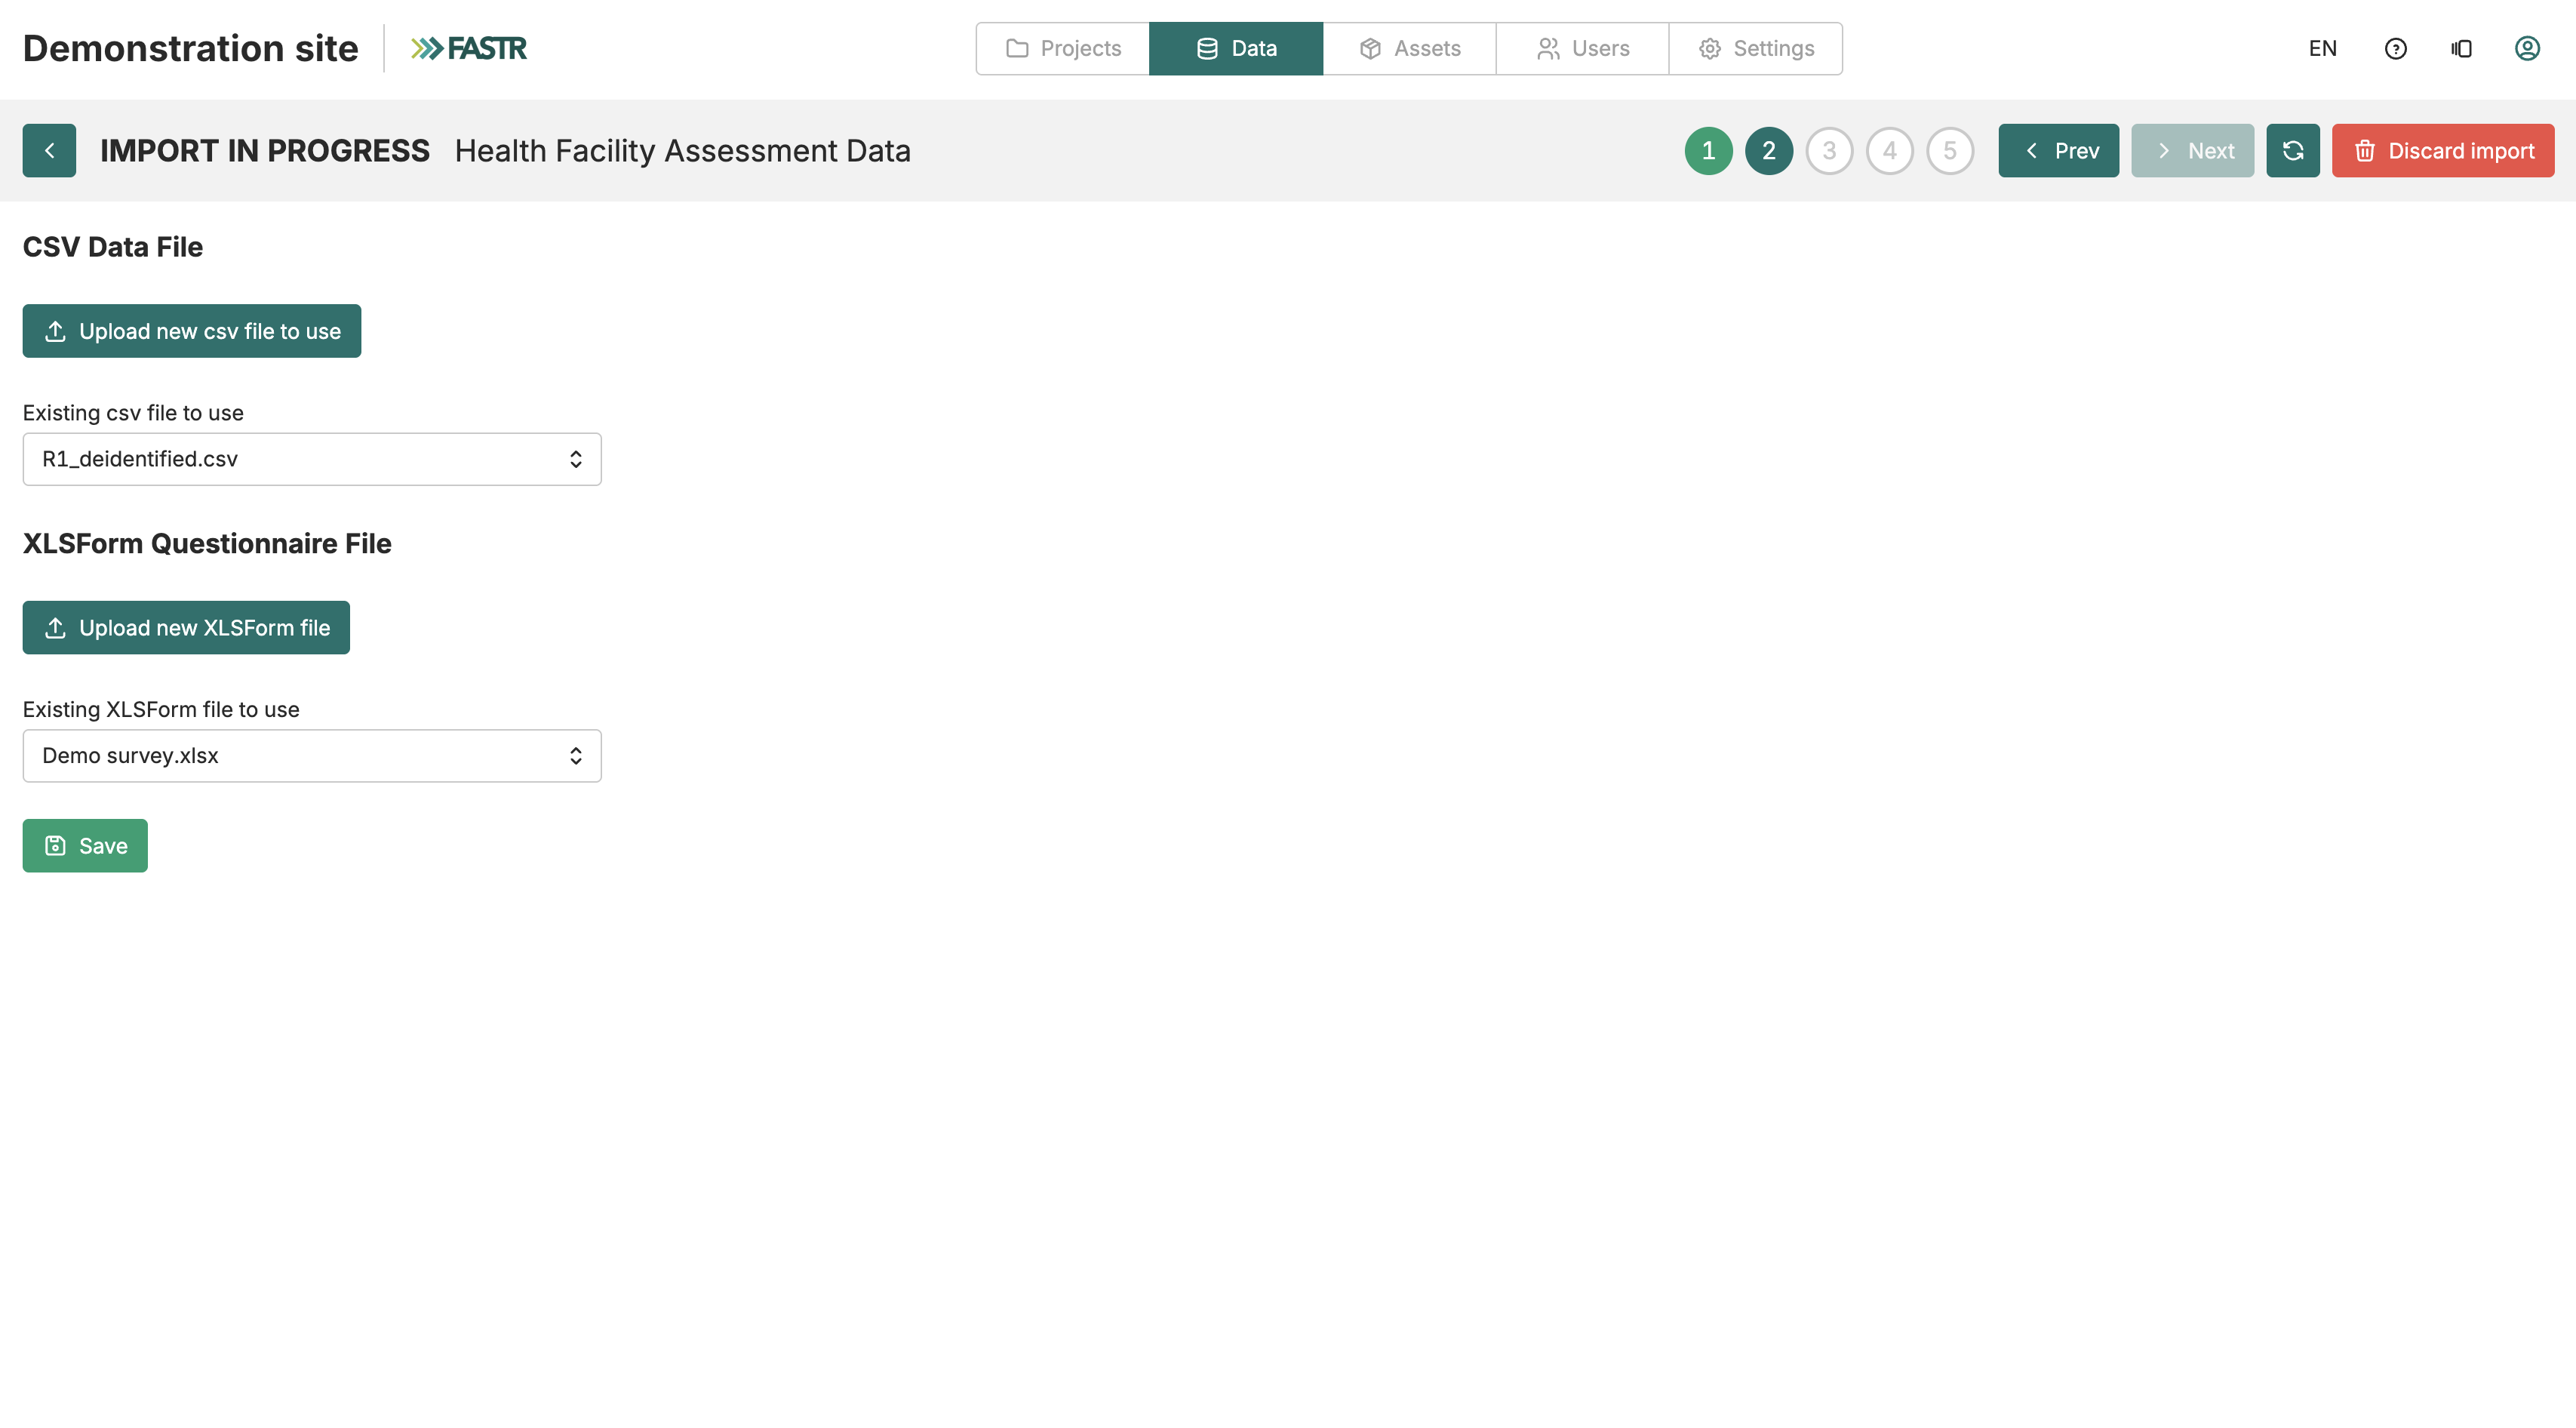
Step 1 — Upload files
Section titled “Step 1 — Upload files”Select or upload your CSV data file and your XLSForm questionnaire file. Both files must be present before the wizard can proceed; the wizard parses the CSV headers against the XLSForm as soon as both are selected. If the files cannot be parsed together, an error appears and you should verify the XLSForm matches the CSV.
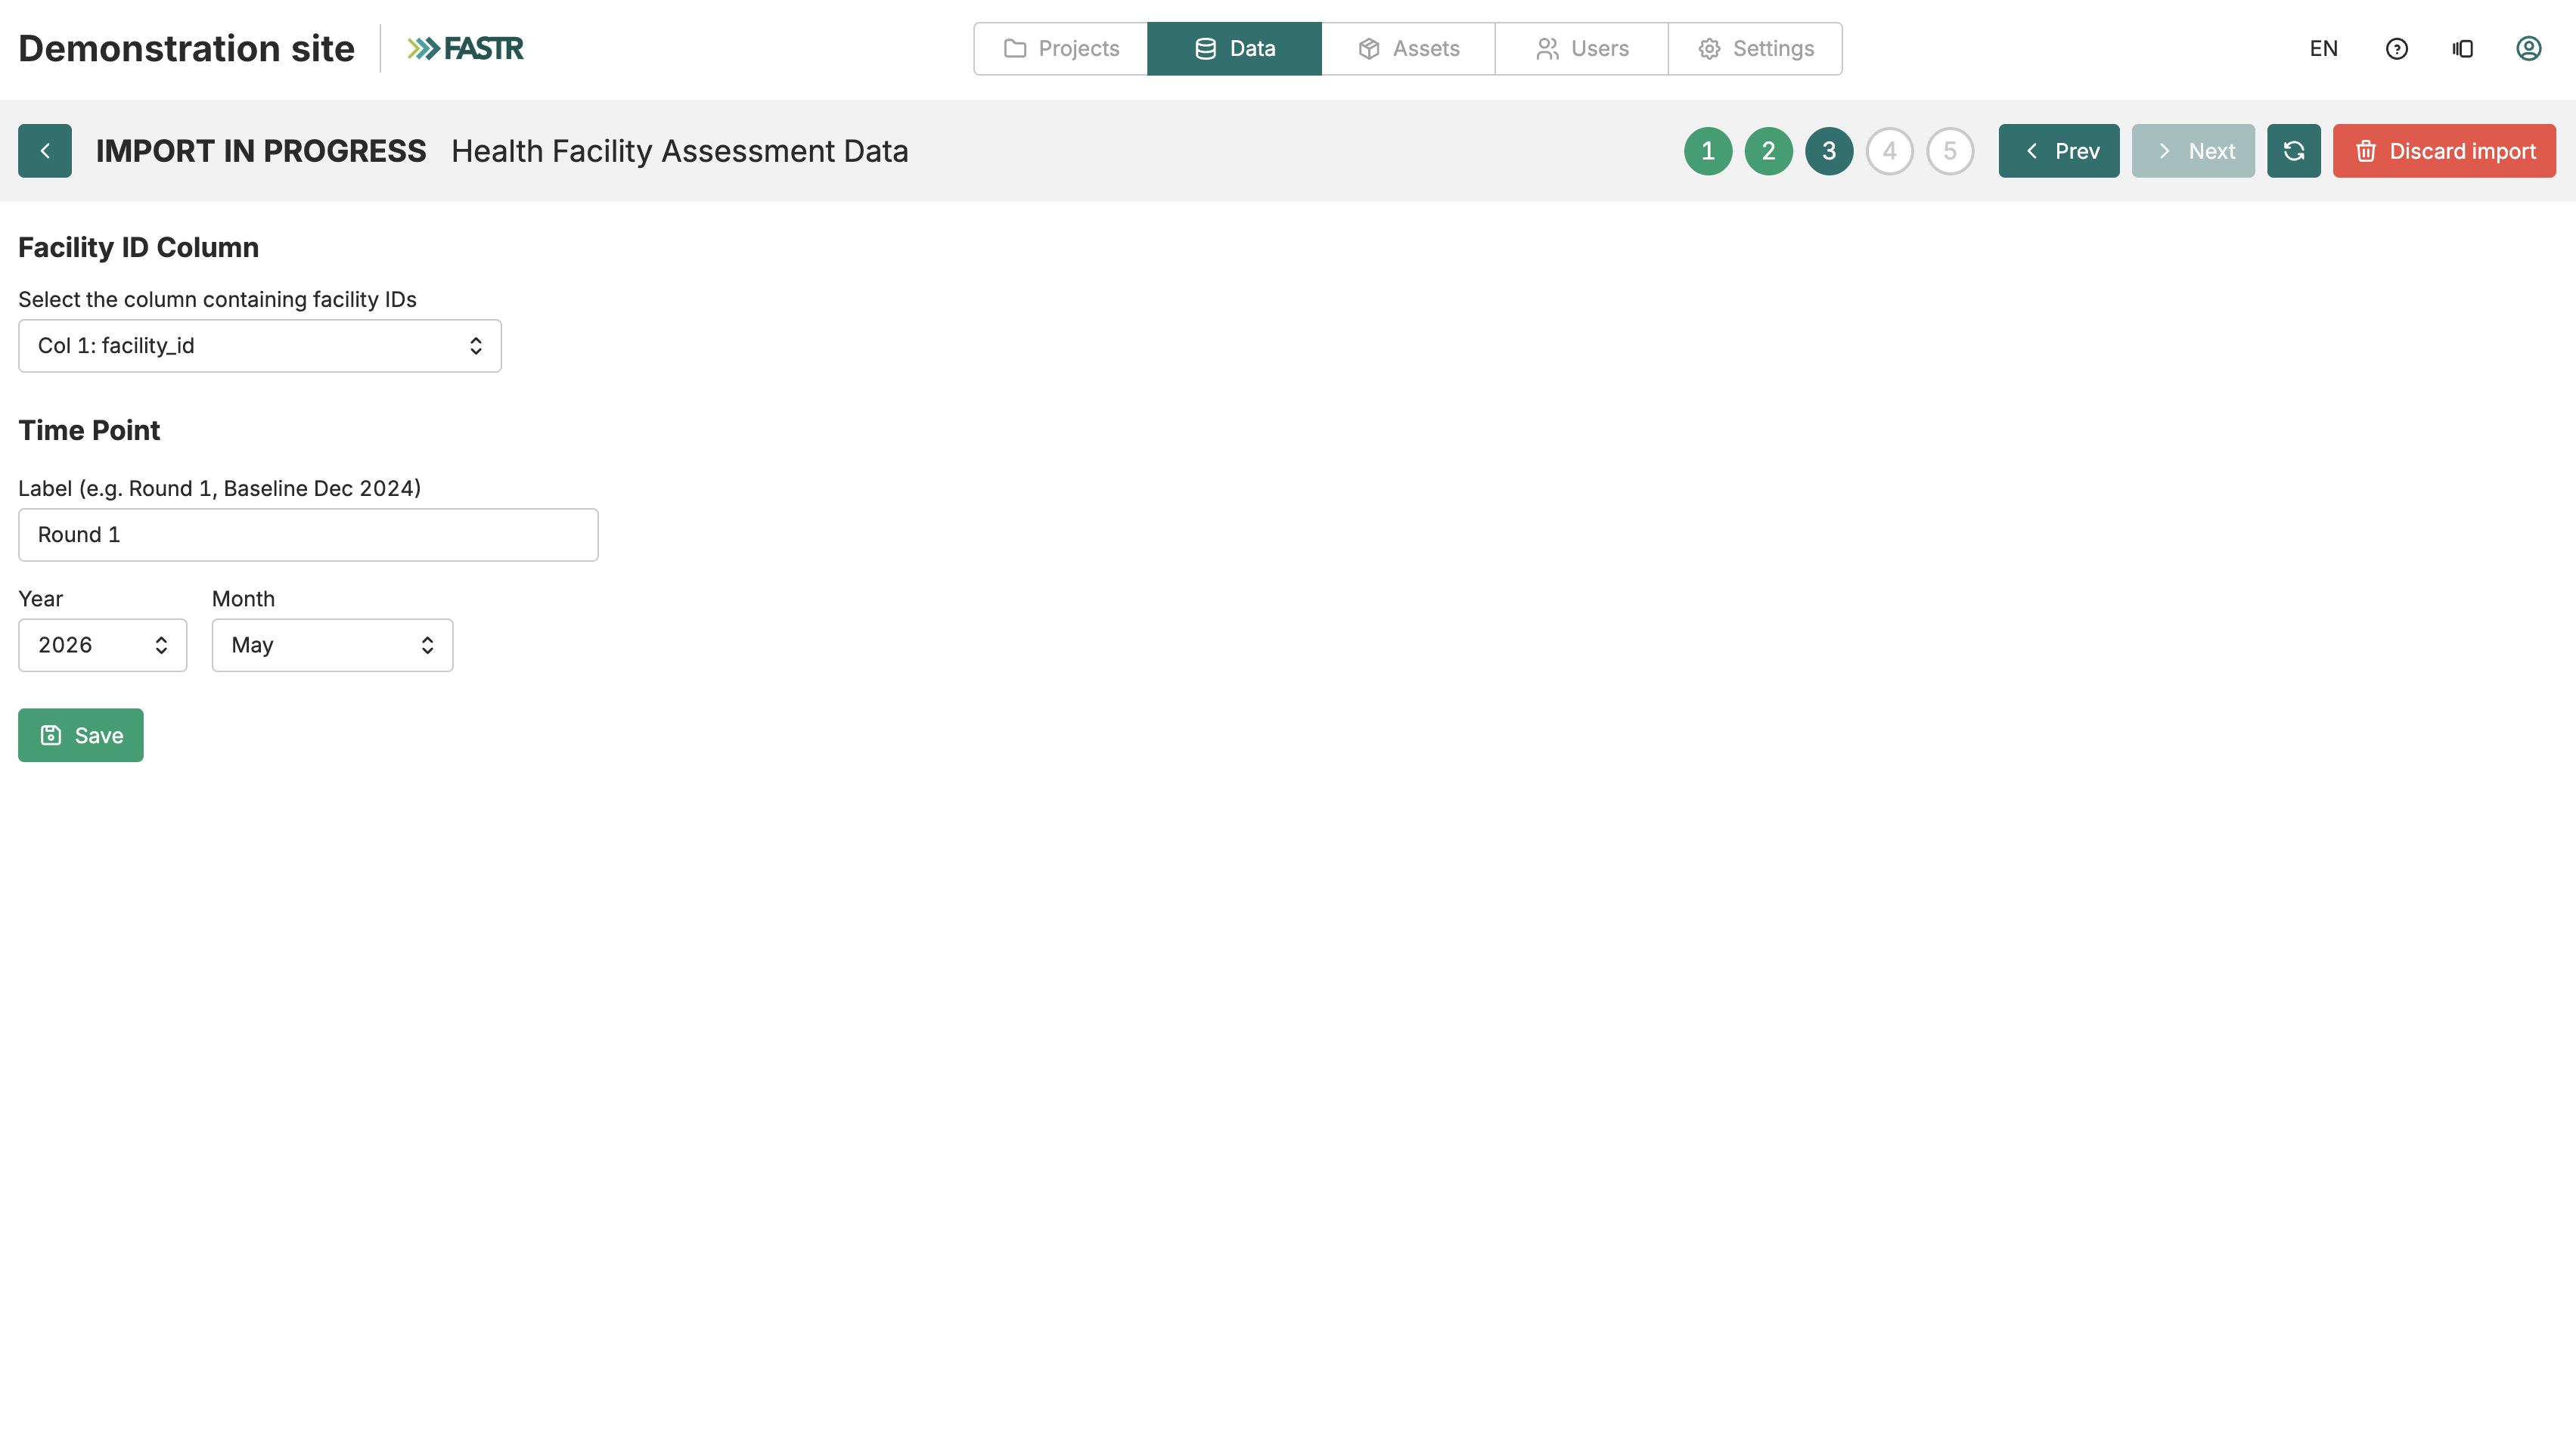
Step 2 — Mappings
Section titled “Step 2 — Mappings”Specify which CSV column contains facility identifiers and select the time point this data belongs to. You can also add optional row filter conditions. Each condition specifies a column, an operator (equals or does not equal), and a value. Rows that fail any condition are dropped before duplicate handling — for example, to keep only surveyed facilities, you might require a consent column to equal 1. Values are compared as exact text.
Step 3 — Duplicates
Section titled “Step 3 — Duplicates”If any facilities appear more than once after filtering, this step lets you choose which row to keep for each. A quick-set control lets you apply “first row” or “last row” across all duplicates at once; you can then override individual facilities. Row numbers count data rows from 1 in file order (excluding the header). If no duplicates exist after filtering, this step is skipped automatically.
Step 4 — Review and launch
Section titled “Step 4 — Review and launch”A summary shows the data file, XLSForm file, column count, time point, facility ID column, row filters, and duplicate count. Read the notice: the import replaces all existing data for the selected time point. Click Start import to launch.
Once launched, the import runs on the server. A fully clean file integrates automatically without further steps. If staging drops any rows, the import pauses in a needs review state — nothing is merged until you act.
Monitoring imports
Section titled “Monitoring imports”Click Imports to open the imports history. The Current section shows any running import with a live progress bar and percentage. The History table lists all completed, cancelled, and errored runs with their time point, file name, values imported, and status. Click any history row to see the full run detail including staging diagnostics.
Needs review
Section titled “Needs review”When staging drops facility rows, the import holds in a needs review state. A card at the top of the imports view explains what happened and shows the staging results. You can choose to Integrate anyway — merging the surviving rows — or Discard to abandon the import without merging anything.
Cancelling a running import
Section titled “Cancelling a running import”While an import is running, a Cancel import button appears. Cancelling stops the run; nothing already merged is affected.
Time points
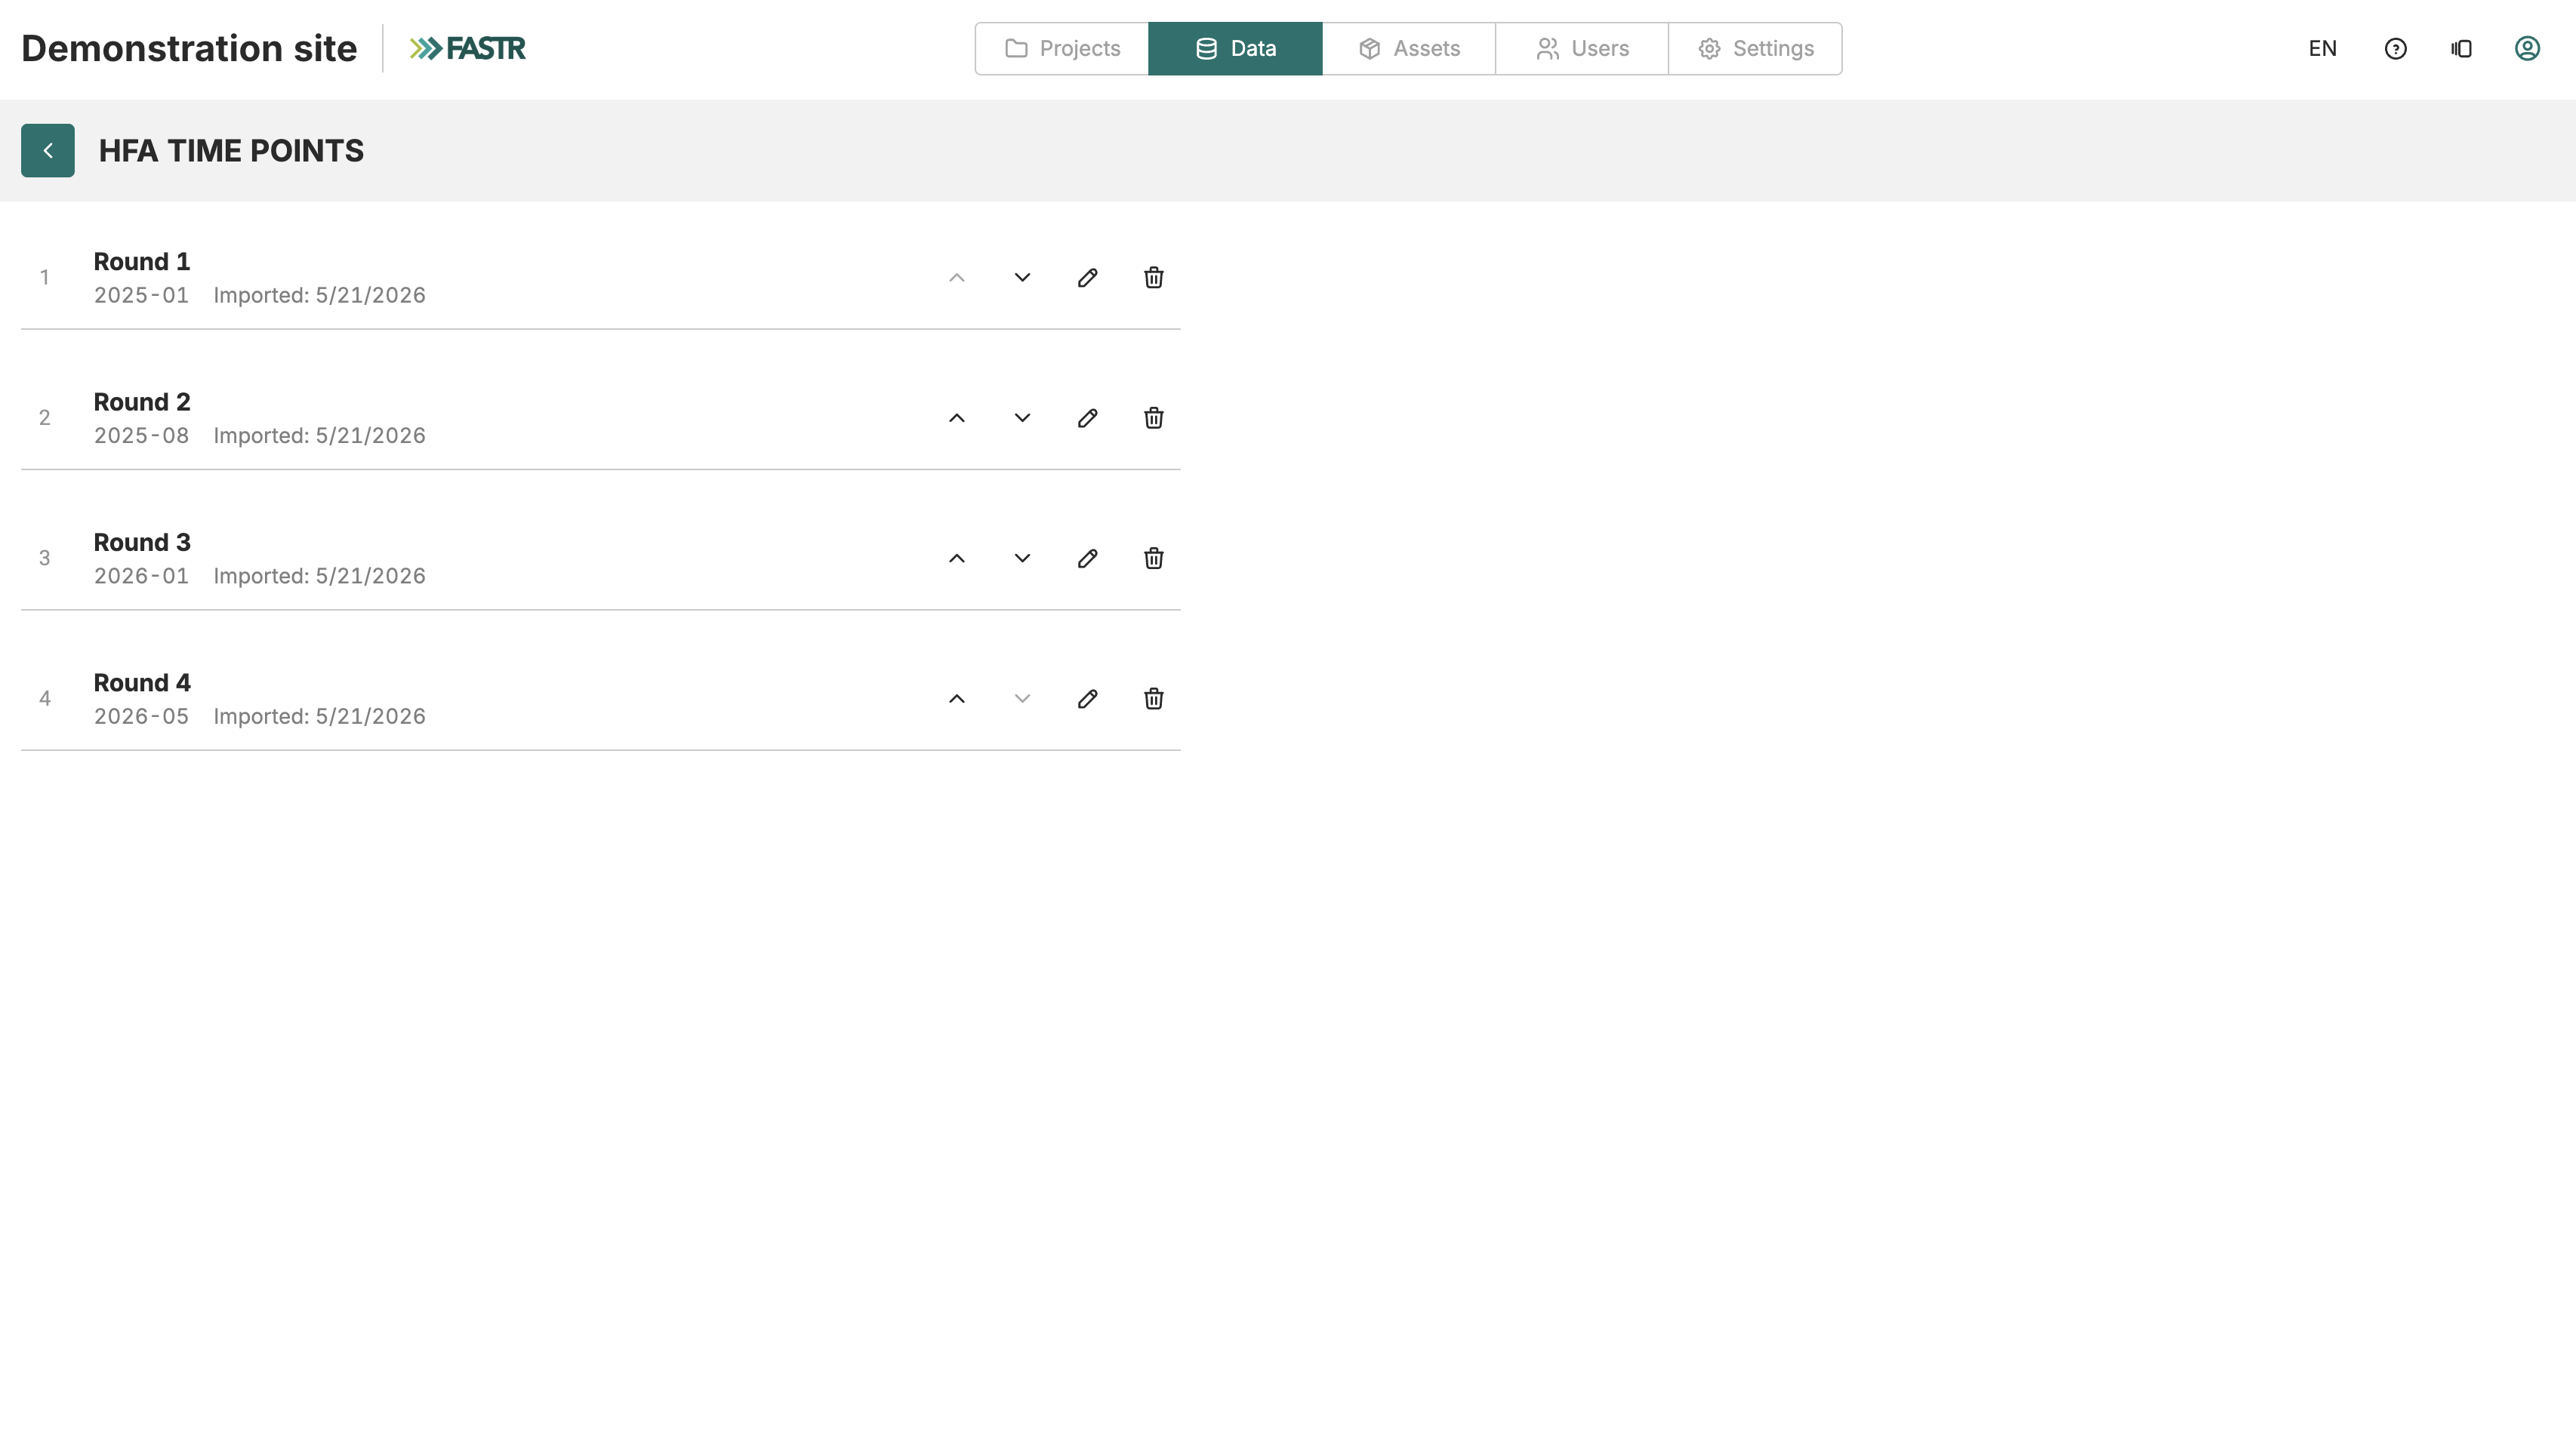
Section titled “Time points”HFA data is organized by time points rather than continuous periods. Before importing data, create your time points on the HFA Time Points page. Each time point has a label and a calendar period (year and month). Time points define the named rounds - such as “Round 1” or “Baseline Dec 2024” - that appear throughout the platform.
After importing, use the HFA Time Points page to edit labels, adjust dates, reorder, add new time points, or delete individual survey rounds. Deleting a time point removes all its data and sampling weights.
Validation details
Section titled “Validation details”Rows can be dropped during staging for several reasons: missing facility IDs, facility IDs not in your registry, duplicate facilities within a single import (handled by the strategy you chose in the duplicates step), or rows excluded by the filter conditions you set in the mappings step. The staging summary shows each category separately. If you see many “Facility Not Found” entries, check whether your facility registry needs updating.
XLSForm handling
Section titled “XLSForm handling”FASTR extracts survey structure from your XLSForm to provide meaningful labels throughout the platform. Variable names become technical identifiers. Labels appear in visualizations and reports. Value labels map numeric response codes to descriptive text.
For “select_multiple” questions, FASTR automatically expands each choice into a separate binary variable - a question with five options becomes five yes/no indicators.
Certain variable names are reserved and cannot be used as survey variable names. Reserved names include R functions and operators used in indicator code, as well as columns the analysis script generates (such as weight, time_point, and facility-related columns). If your XLSForm contains a reserved variable name, rename it before importing.
Working with HFA data
Section titled “Working with HFA data”Once imported, HFA data flows into the analytical pipeline alongside HMIS data. Modules can reference HFA variables in their calculations, and visualizations can display facility assessment results. Because HFA represents discrete survey rounds rather than continuous reporting, it’s typically used for cross-sectional comparisons rather than time trends.