
Data quality assessment (DQA)
Background and purpose
Section titled “Background and purpose”Objective of the module
Section titled “Objective of the module”The Data Quality Assessment (DQA) module evaluates the reliability of routine Health Management Information System (HMIS) data reported by health facilities. It functions as an initial quality control step within the FASTR pipeline, reviewing monthly facility reports to identify data quality issues prior to their use in downstream analysis.
The module assesses data quality across three complementary dimensions: outliers, which identify unusually high reported values that may reflect reporting or data entry errors; completeness, which measures the regularity and continuity of facility reporting over time; and consistency, which evaluates whether related indicators exhibit expected relationships. These dimensions are combined into an overall DQA score, providing a standardized summary measure of data reliability.
Routine HMIS data are a primary source for monitoring health service delivery at both facility and population levels, capturing events such as immunizations delivered and births attended by skilled health personnel. As with all routinely collected data, HMIS data are subject to quality limitations. The FASTR DQA module applies a systematic review of monthly data at the facility and indicator levels to identify and characterize these limitations. Results are summarized as annual estimates, which may reflect partial-year data depending on data availability at the time of analysis (for example, analyses conducted mid-year may include data only for the months available).
Analytical rationale
Section titled “Analytical rationale”Data quality directly affects the reliability of health indicators and coverage estimates. Before service utilization rates or population coverage are calculated, it is necessary to assess whether the underlying facility data are sufficiently reliable. This module identifies data patterns that may distort analytical results, allowing users to make informed decisions about data treatment in subsequent steps of the pipeline.
FASTR approach to data quality
Section titled “FASTR approach to data quality”FASTR takes a multi-pronged approach, based on the belief that data quality should not be a barrier to data use. The approach emphasizes conducting granular, facility-level data quality assessments; focusing on high-volume indicators that produce more stable estimates; emphasizing variation over time and space rather than point estimates; and interpreting results collaboratively with in-country decision-makers. Using data and providing feedback is viewed as the first step toward improving data quality.
Key points
Section titled “Key points”| Component | Details |
|---|---|
| Inputs | Raw HMIS data (hmis_ISO3.csv) containing facility service volumes by month and indicatorGeographic/administrative area identifiers Standardized indicator names |
| Outputs | M1_output_outliers.csv — facility-month-indicator outlier flagsM1_output_outlier_list.csv — flagged outliers only (review list)M1_output_completeness.csv — facility-month-indicator completeness flagsM1_output_consistency_geo.csv — sub-national consistency results by ratio pairM1_output_dqa.csv — composite DQA scores (mean and pass/fail) |
| Purpose | Evaluate HMIS data reliability through outlier detection, completeness assessment, and consistency checking to ensure trustworthy inputs for coverage estimation |
!!! warning “Reminder: input must be counts, not percentages”
This module expects **raw service counts** (e.g. number of visits, doses, deliveries reported by each facility each month). Percentages, rates, or pre-calculated coverage figures cannot be analyzed here — outlier detection compares values against a facility's own volume distribution (a percentage capped at 100 has no signal), and completeness flags depend on whether a count was reported. See [Data extraction](02_data_extraction) for what to pull from your HMIS.Analytical workflow
Section titled “Analytical workflow”Overview of analytical steps
Section titled “Overview of analytical steps”The module applies a structured sequence of data quality checks, progressing from individual observations to an overall assessment of data reliability:
Step 1: Data preparation
Monthly facility reports are loaded and organized for analysis. Dates are standardized, and the geographic units and health indicators available in the dataset are identified.
Step 2: Outlier detection
For each facility and indicator (for example, pentavalent vaccine doses or antenatal care visits), the module identifies unusually high values that may reflect reporting or data entry errors. Two complementary approaches are used: statistical outlier detection based on deviations from a facility’s historical reporting pattern, and proportional checks that flag months accounting for an implausibly large share of the facility’s trailing 12-month service volume for that indicator.
Step 3: Completeness assessment
The module evaluates the consistency of facility reporting over time by constructing a complete reporting timeline for each facility–indicator combination and identifying missing months. Facilities with extended periods of non-reporting (six months or more) are classified as inactive rather than incomplete.
Step 4: Consistency assessment
Related indicators are expected to follow predictable relationships. For example, the number of first antenatal care visits should exceed the number of fourth visits. The module assesses these relationships using indicator ratios calculated at the district level, reducing bias from patient movement across facilities, and flags deviations from expected patterns.
Step 5: Indicator availability checks
Before consistency assessments are applied, the module verifies that the required indicator pairs are present in the data. Where indicators are missing, the analysis adapts to the available information without generating errors.
Step 6: DQA score calculation
For a defined set of core indicators (typically first-dose pentavalent vaccination, first antenatal care visit, and outpatient department visits), results from the outlier, completeness, and consistency checks are combined into an overall DQA score. A facility–month receives the highest score only if all core indicators meet minimum standards across all three dimensions.
Step 7: Outputs
The module generates a set of structured outputs, including outlier flags, completeness indicators, consistency results, and final DQA scores. These outputs are used in subsequent FASTR modules and provide a transparent basis for data quality review and improvement.
Workflow diagram
Section titled “Workflow diagram”Key decision points
Section titled “Key decision points”When is a value considered an outlier?
Outliers are identified by assessing within-facility variation in monthly reporting for each indicator. A value is flagged as an outlier if it meets either of the following criteria:
- The value exceeds 10 times the Median Absolute Deviation (MAD) from the monthly median for the indicator; or
- The value accounts for more than 80 percent of the total reported volume for a given facility, indicator, and year and the reported count exceeds 100.
The MAD is calculated using only values at or above the median, in order to focus detection on unusually high values and avoid flagging low-volume observations.
Why is consistency assessed at the district level rather than the facility level?
Patients frequently seek care from different facilities within the same district depending on the service. For example, a woman may receive her first antenatal care visit at a primary health center but deliver at a district hospital. Assessing consistency at the district level accounts for this patient movement and provides a more accurate representation of service utilization patterns.
What happens when required indicators are missing?
The module adapts to the data that are available. If required indicator pairs for consistency assessment are missing, consistency checks are not applied, and the DQA score is calculated using only outlier and completeness dimensions. Analysis proceeds using the quality dimensions that can be assessed.
How are inactive facilities handled?
Facilities that do not report for six or more consecutive months at the beginning or end of their reporting period are classified as inactive for those months rather than incomplete. This prevents penalizing facilities that have not yet begun reporting or that have permanently ceased operations.
Data processing and outputs
Section titled “Data processing and outputs”Transformation overview
The module transforms raw facility reports into quality-flagged datasets through the following steps:
- Input format: Monthly observations with facility identifier, reporting period, indicator, and reported count
- Enrichment: Calculation of supporting statistics, including median values, MAD-based residuals, and proportional volume contributions
- Completion: Explicit generation of records for missing months, converting implicit reporting gaps into observable data points
- Aggregation: Aggregation of facility-level data to the district level for consistency assessment
- Flagging: Assignment of binary quality flags for outliers, completeness, and consistency
- Scoring: Combination of quality flags into continuous scores (0–1) and corresponding pass/fail indicators
- Output format: Production of multiple output files tailored to different analytical uses, including rapid outlier review, full data quality analysis, and inputs for downstream FASTR modules
The module processes data in long format, with one record per facility–indicator–period combination, and outputs standardized data quality measures that are used by subsequent modules to inform data adjustment, weighting, or exclusion decisions.
Analysis outputs and visualization
Section titled “Analysis outputs and visualization”The FASTR analysis generates six main visual outputs (each is also produced as a corresponding sub-national map, except for completeness over time):
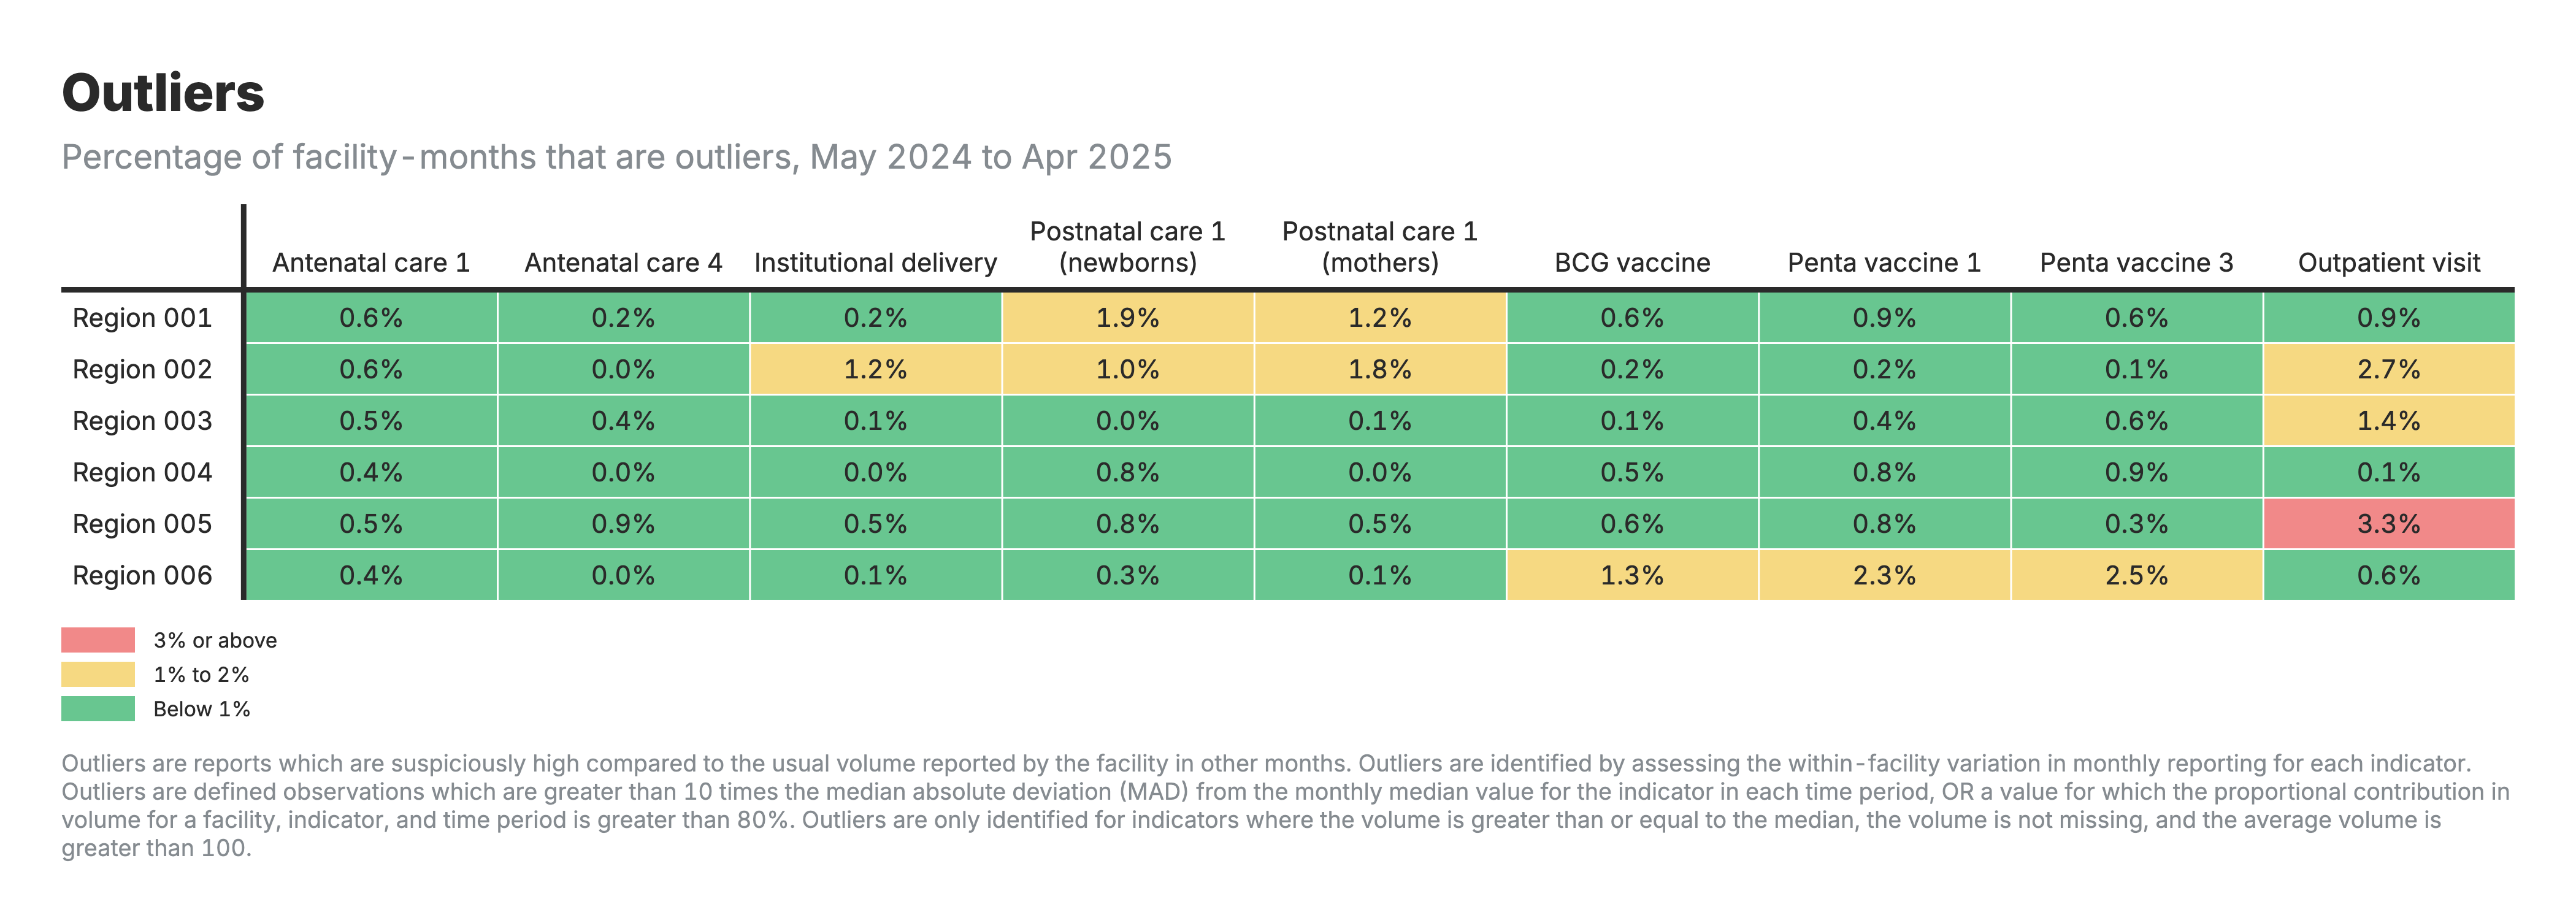
1. Outliers heatmap
Heatmap table with zones as rows and health indicators as columns, color-coded by outlier percentage.
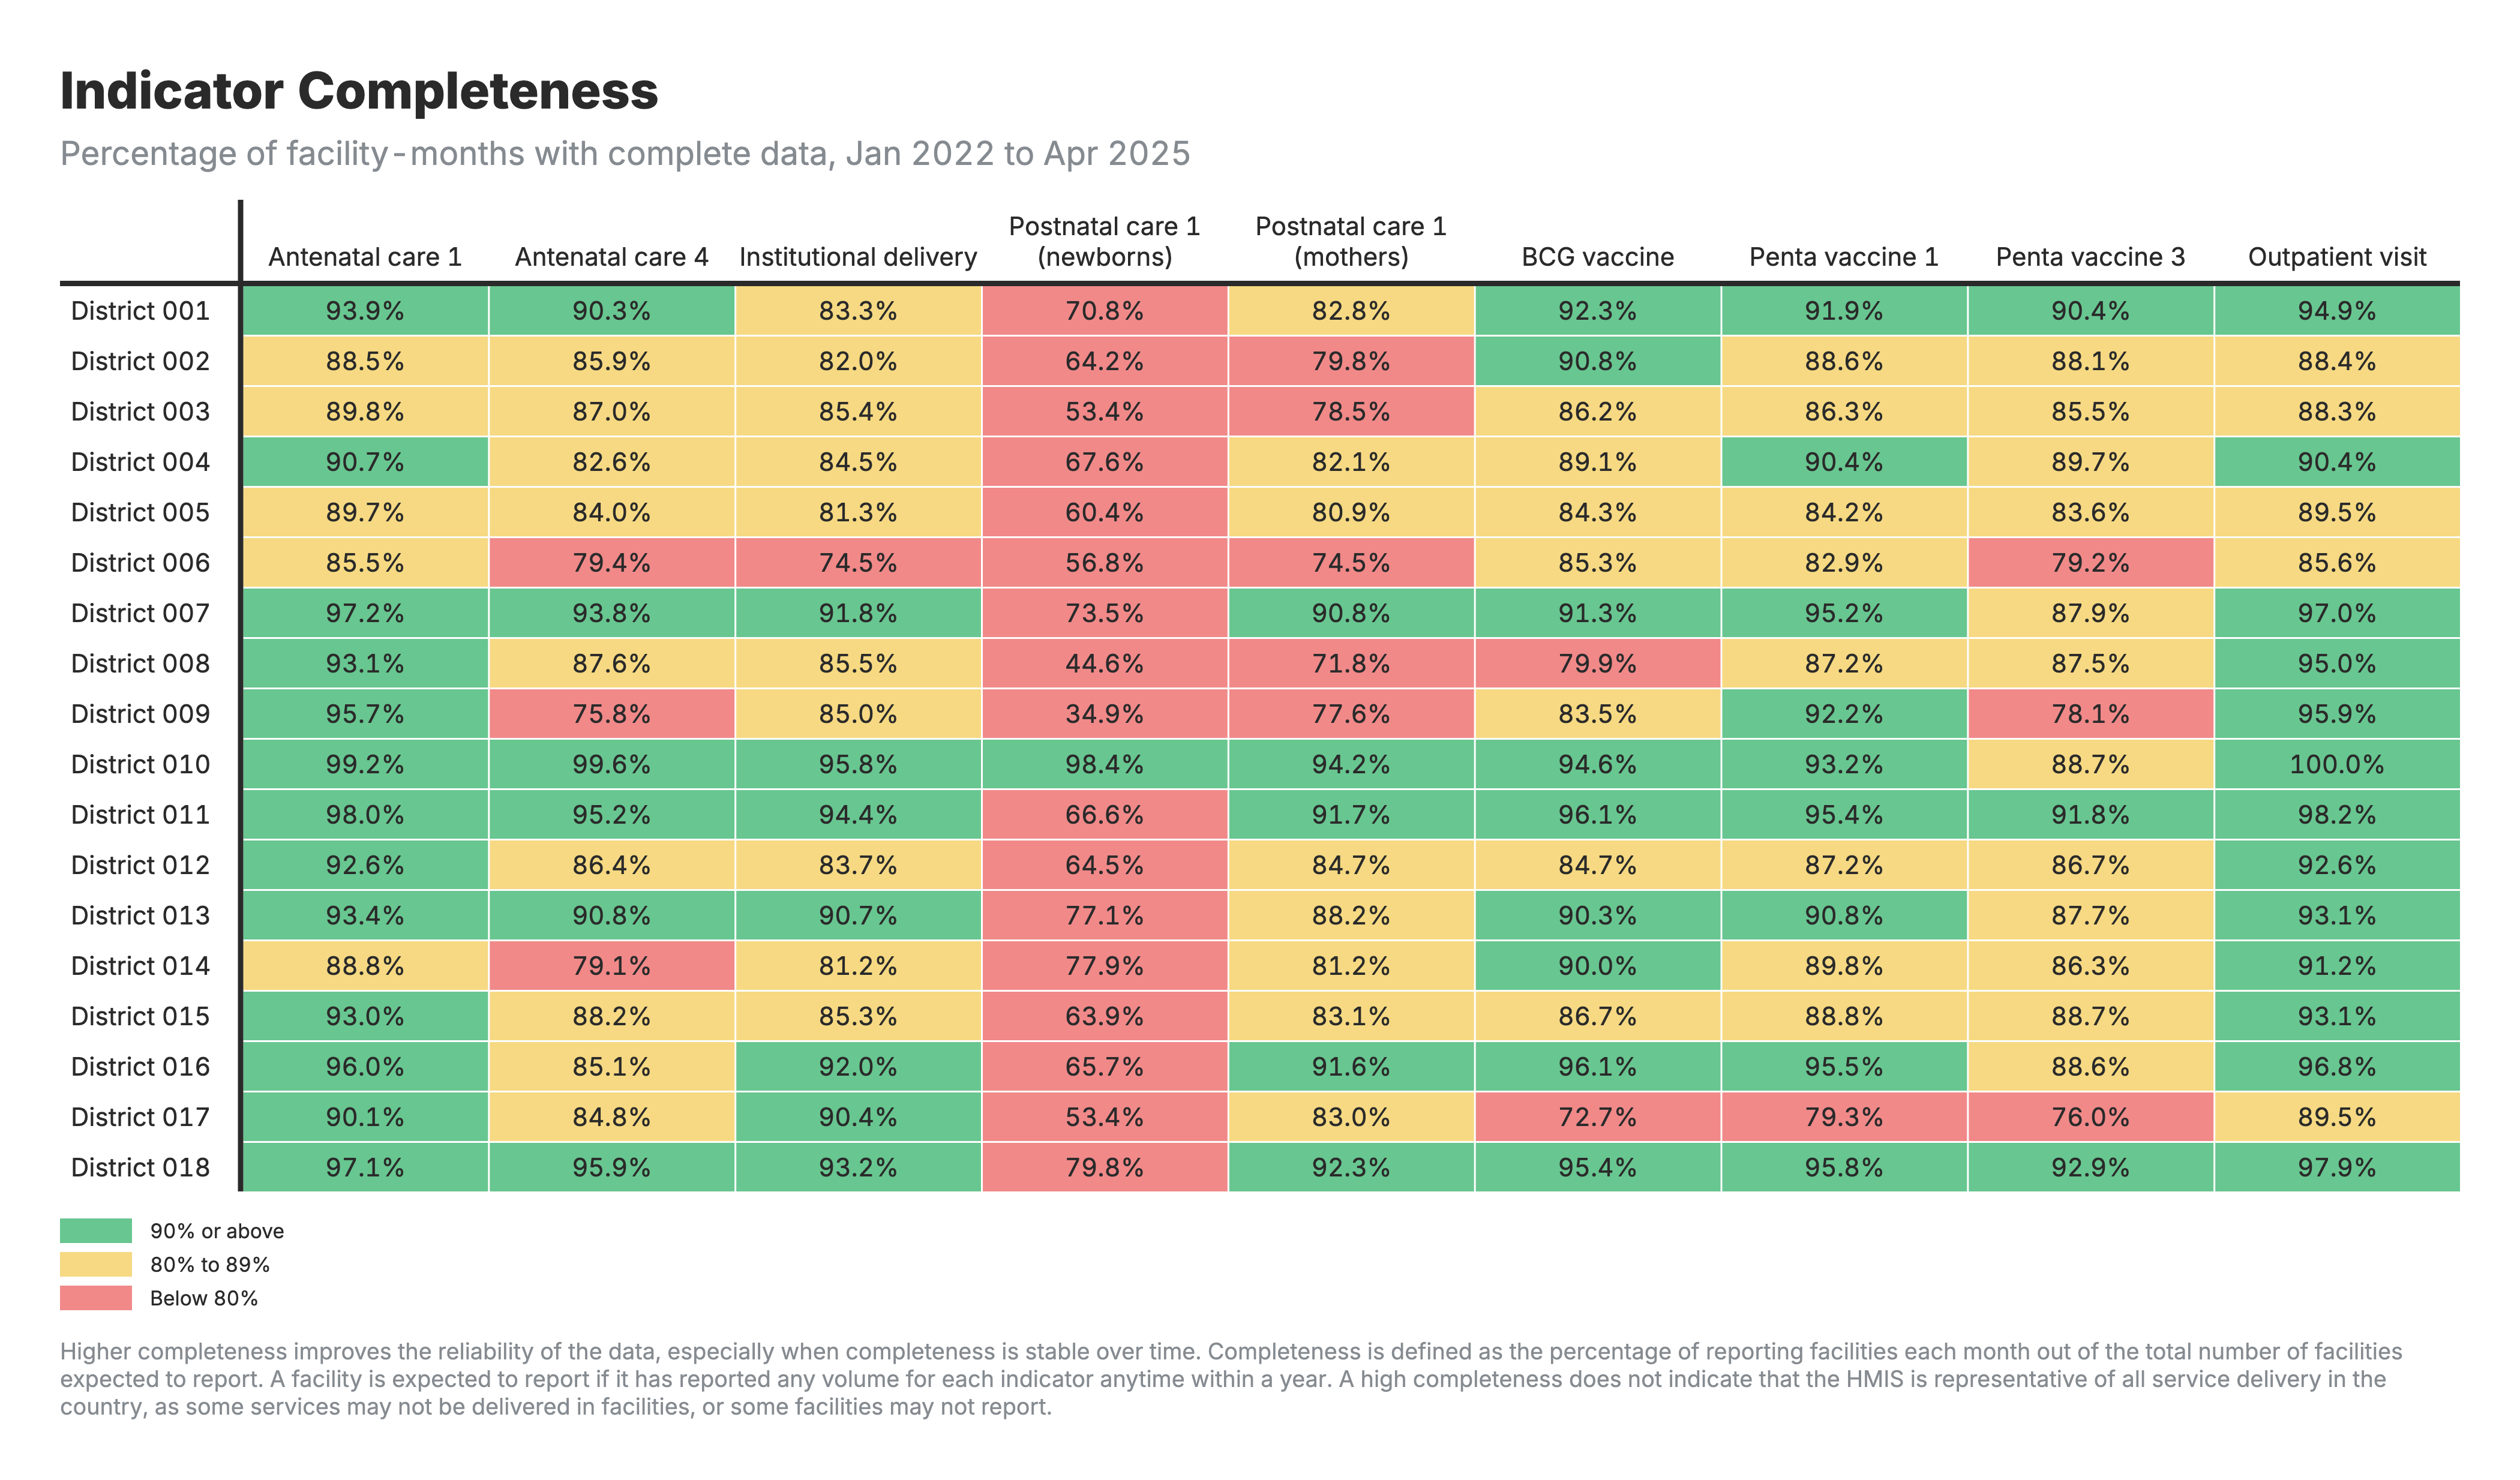
2. Indicator completeness
Heatmap table with zones as rows and health indicators as columns, color-coded by completeness percentage.
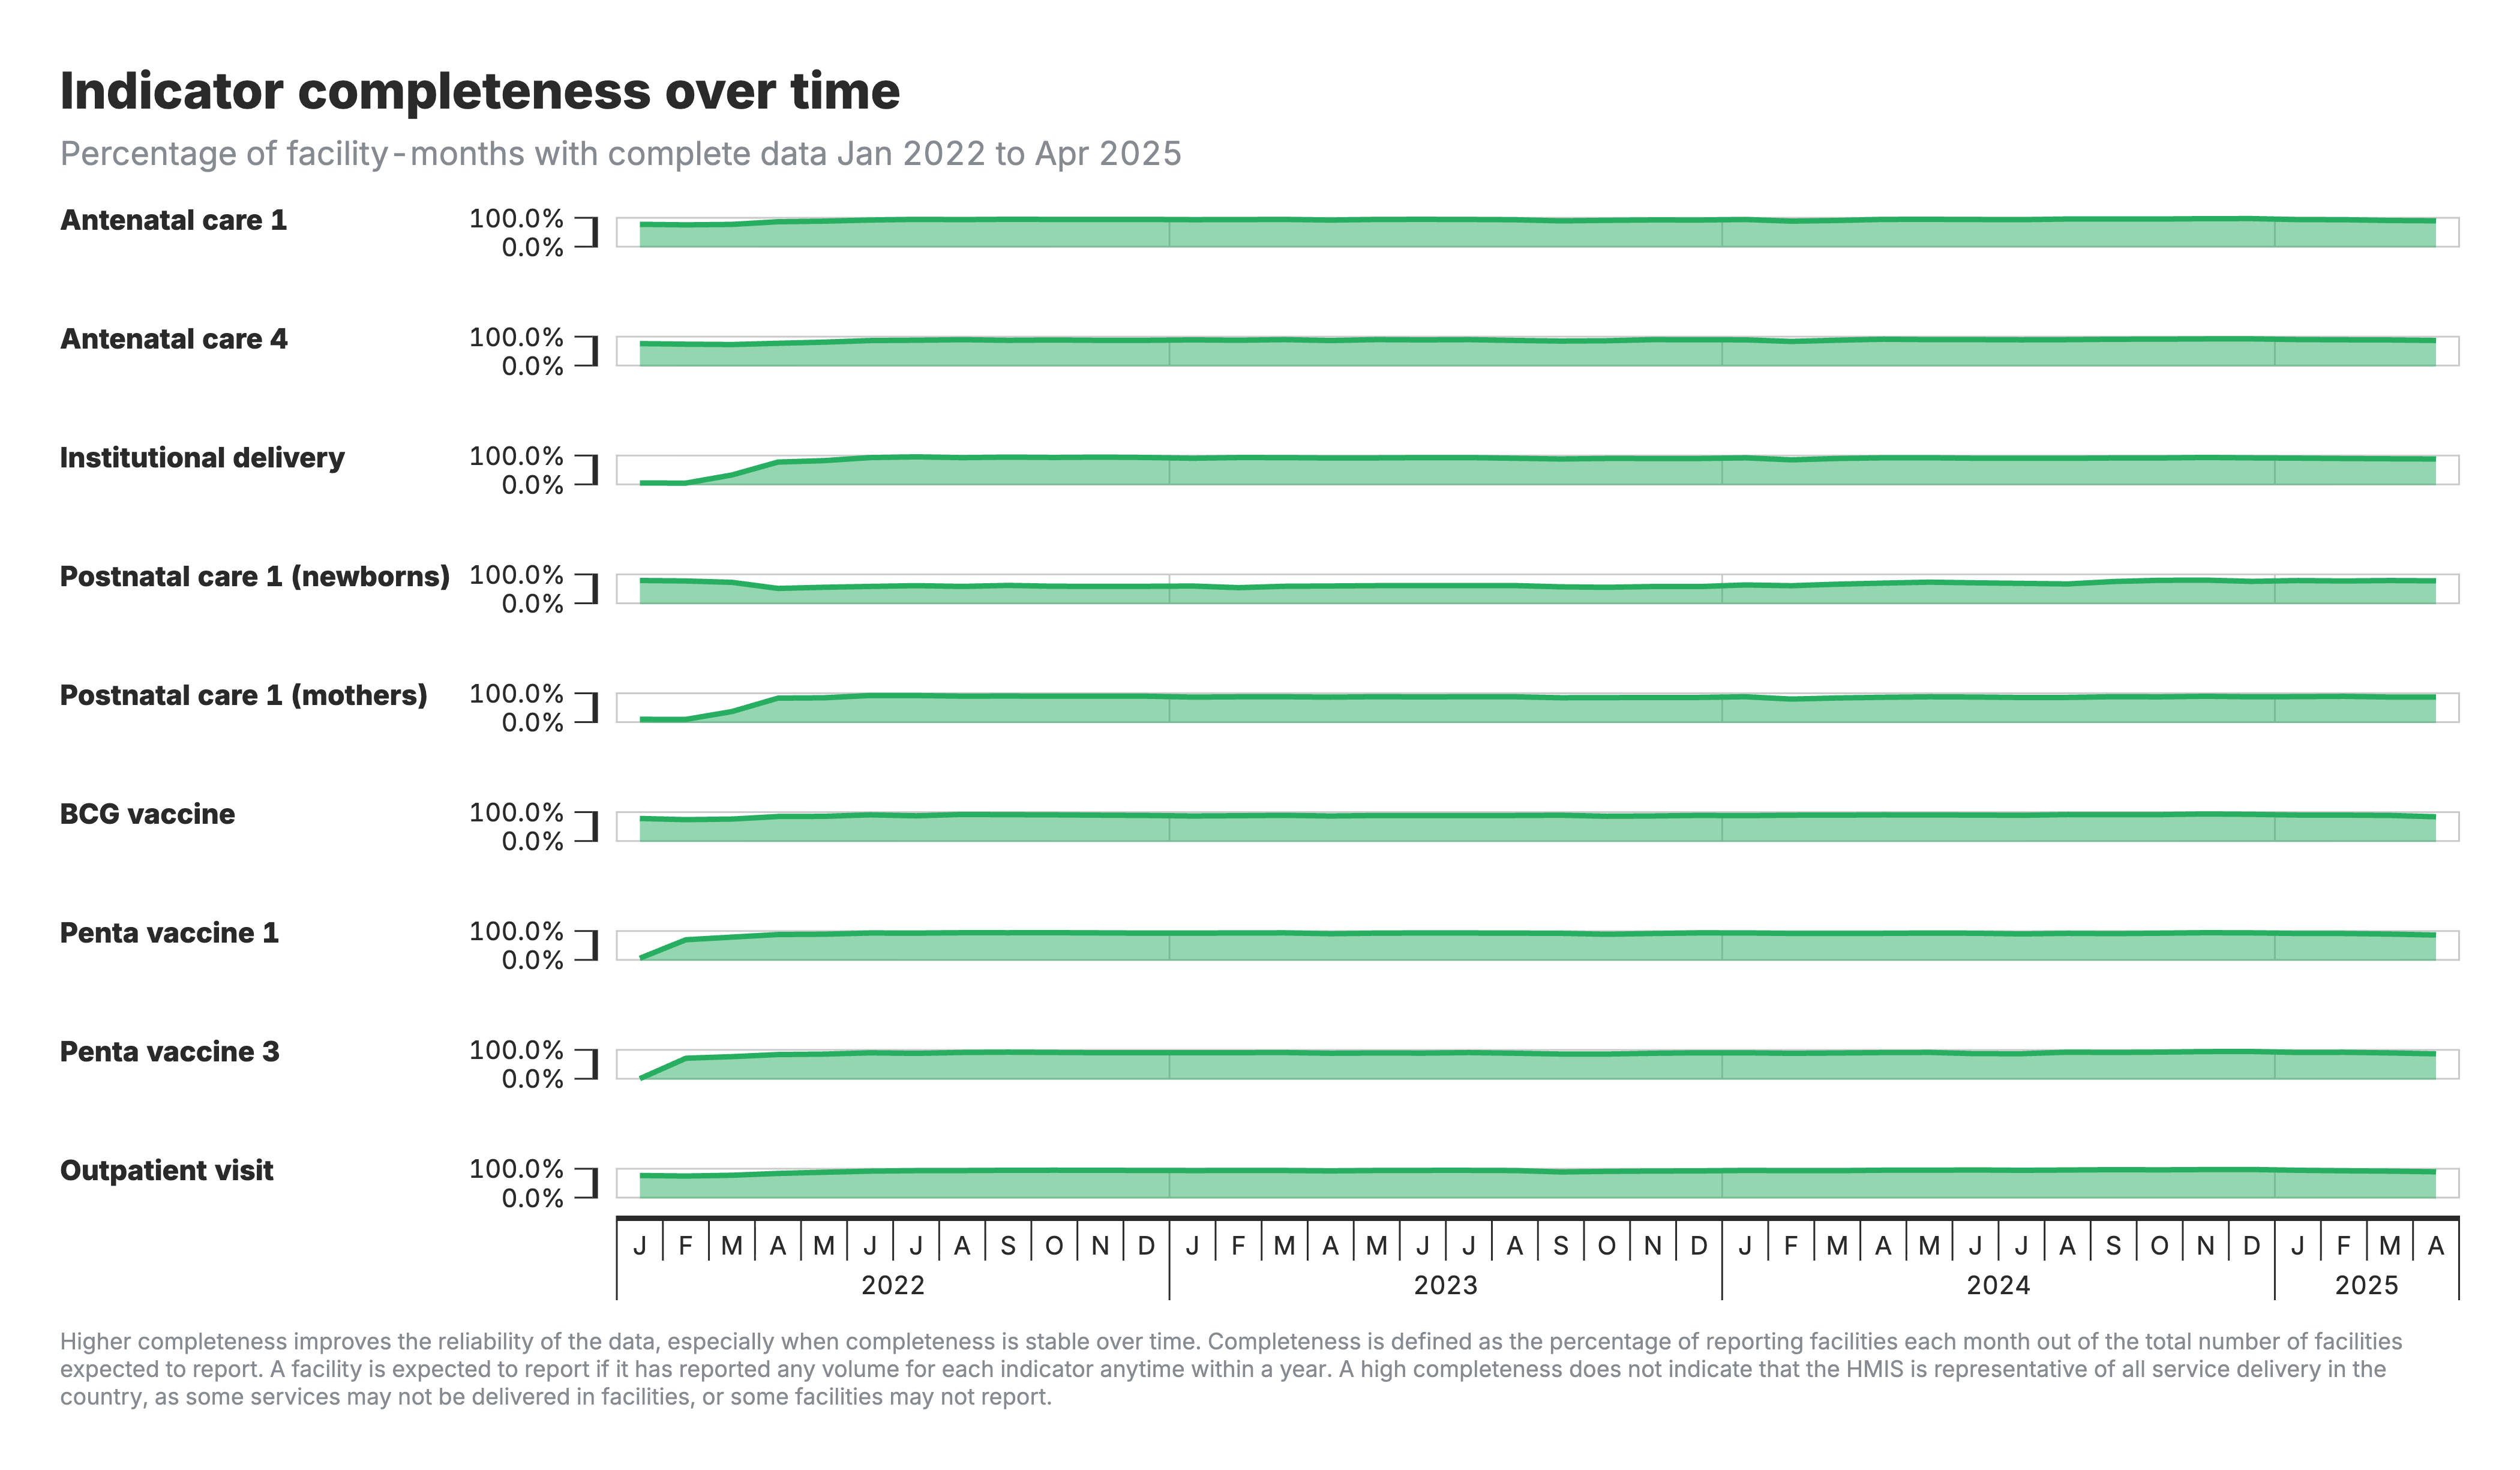
3. Indicator completeness over time
Horizontal timeline charts showing completeness trends for each indicator over the analysis period.
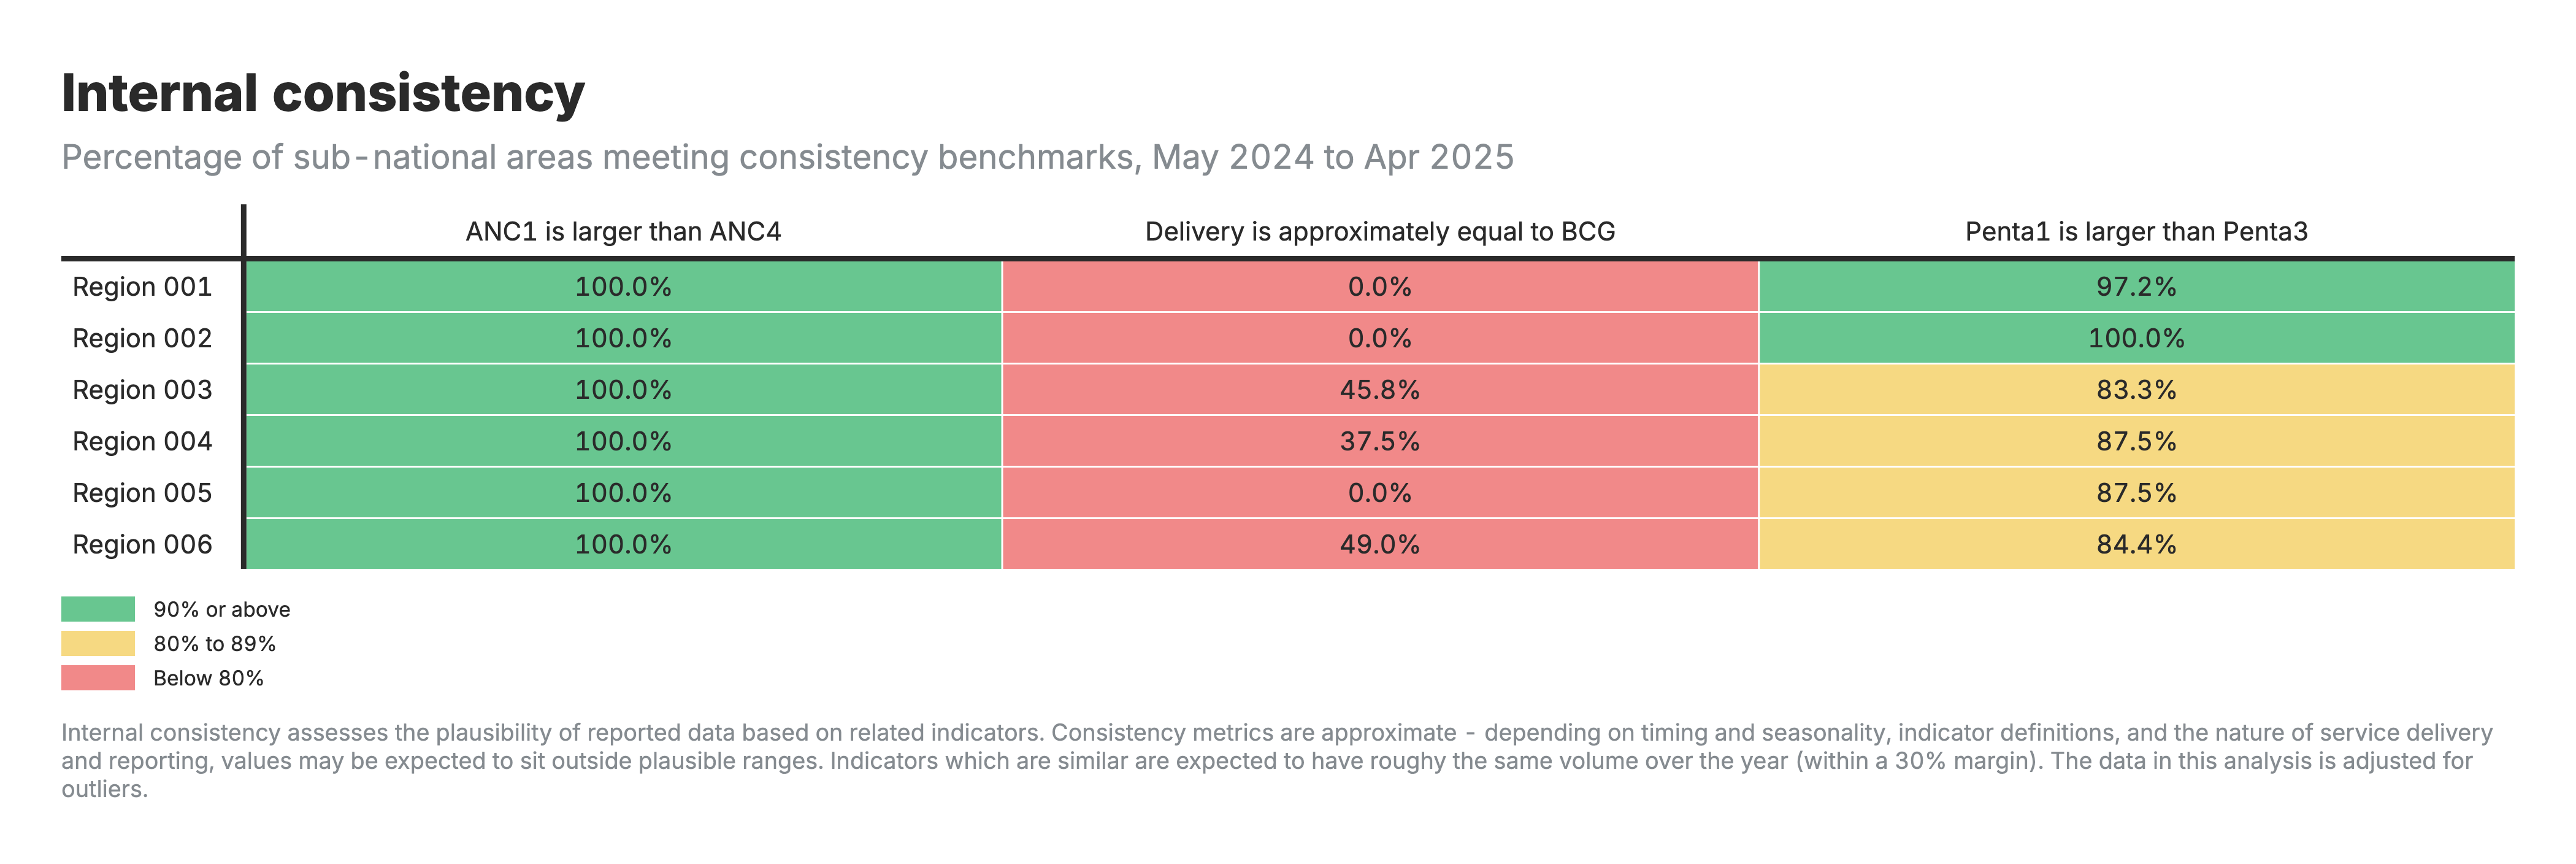
4. Internal consistency
Heatmap table with zones as rows and consistency benchmark categories as columns, color-coded by performance.
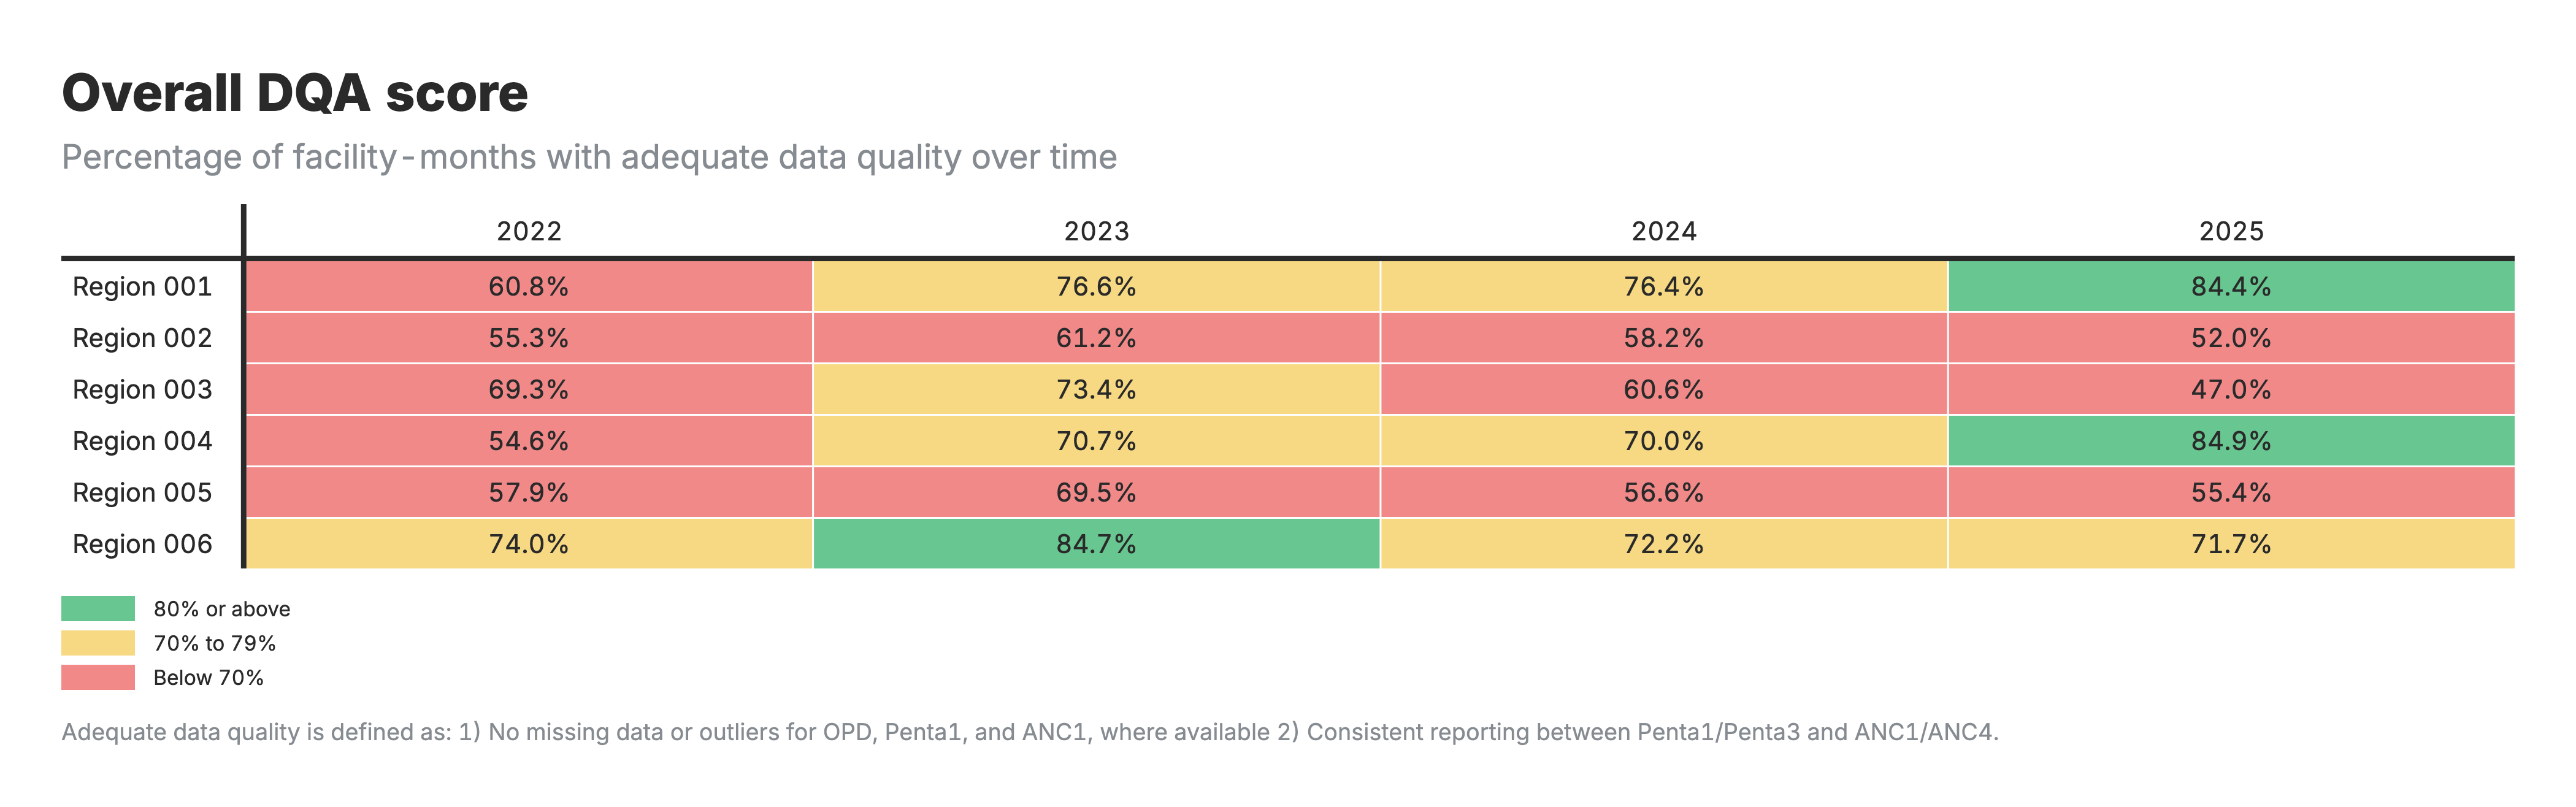
5. Overall DQA score
Heatmap table with zones as rows and time periods as columns, color-coded by DQA score percentage.
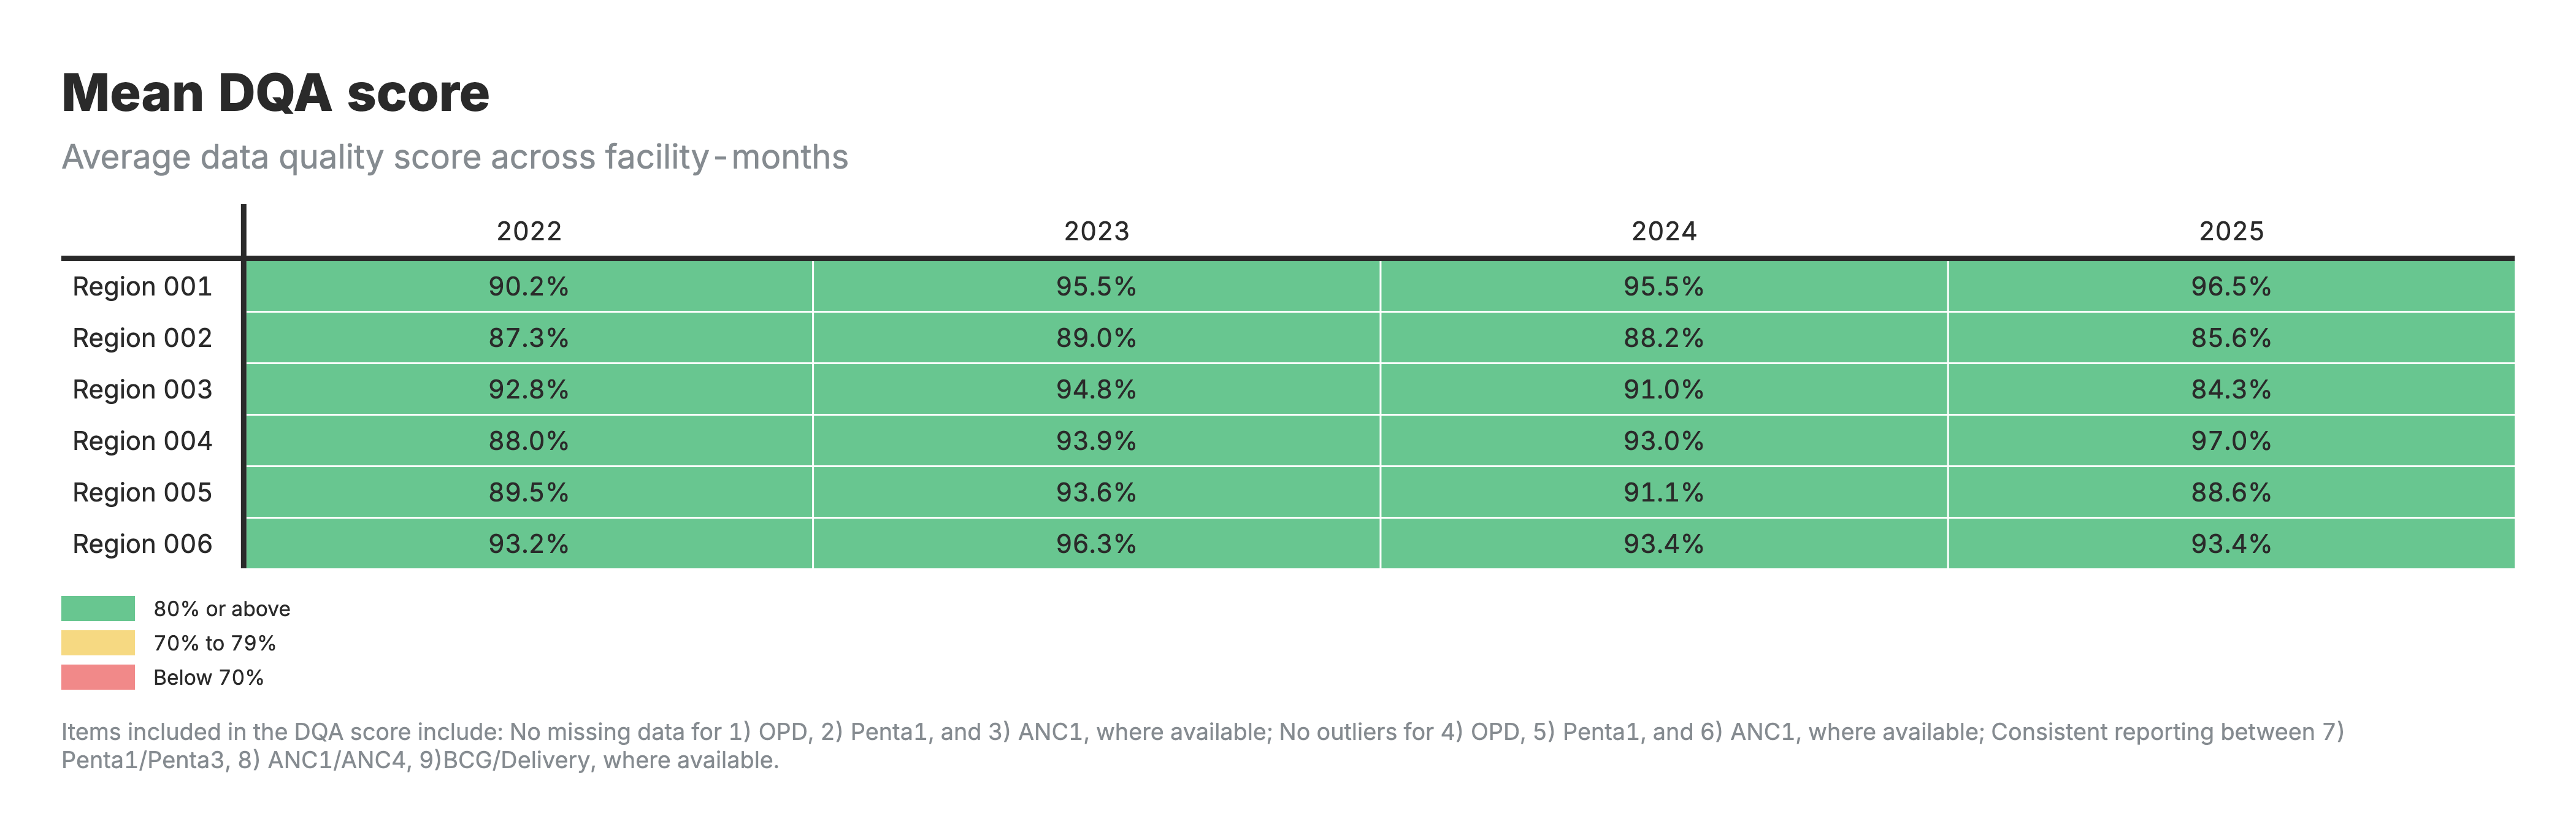
6. Mean DQA score
Heatmap table with zones as rows and time periods as columns, color-coded by average DQA score.
Interpretation guide
For the heatmaps (outputs 1, 2, 4, 5, 6):
- Rows: Geographic areas (zones/regions)
- Columns: Health indicators or time periods
For the outliers heatmap (output 1):
- Values: Percentage of facility-months flagged as outliers
- Lower percentages indicate fewer extreme values
For the indicator completeness heatmap (output 2):
- Values: Percentage of facility-months with complete reporting
- Higher percentages indicate more complete reporting
For the indicator completeness over time chart (output 3):
- Horizontal timeline chart showing completeness trends by indicator
- X-axis: Time period
- Y-axis: Completeness percentage
- Shows whether reporting is improving, declining, or stable
For the internal consistency heatmap (output 4):
- Values: Percentage of areas meeting consistency benchmarks
- Shows whether related indicators follow expected relationships (e.g., ANC1 ≥ ANC4)
For the DQA score heatmaps (outputs 5–6):
- Output 5: Percentage of facility-months passing all quality checks
- Output 6: Average DQA score across facility-months
- Higher scores indicate better overall data quality
Detailed reference
Section titled “Detailed reference”This section provides technical details for implementers, developers, and analysts who need to understand the underlying methodology.
Configuration parameters
Section titled “Configuration parameters”The module uses several configurable parameters that control analysis behavior:
Geographic settings
# Country identifierCOUNTRY_ISO3 <- "GIN"  # ISO3 country code
# Geographic level for consistency analysisGEOLEVEL <- "admin_area_3"  # Admin level (1=national, 2=region, 3=district, etc.)
The GEOLEVEL parameter determines the aggregation level for consistency analysis. Lower administrative levels (3-4) capture local patterns but may have sparse data. Higher levels (2) provide more stable estimates but may mask local inconsistencies.
Outlier detection parameters
# Proportion threshold for outlier detectionOUTLIER_PROPORTION_THRESHOLD <- 0.8  # Flag if single month > 80% of the trailing 12-month total
# Minimum count to consider for outlier flaggingMINIMUM_COUNT_THRESHOLD <- 100  # Only flag outliers with count > 100
# Number of Median Absolute Deviations for statistical outlier detectionMADS <- 10  # Flag if value > 10 MADs from median
Tuning guidance:
- More sensitive detection: Lower
OUTLIER_PROPORTION_THRESHOLDto 0.6-0.7, reduceMADSto 8 - Less sensitive detection: Increase
OUTLIER_PROPORTION_THRESHOLDto 0.9, increaseMADSto 12-15 - Small facilities: Lower
MINIMUM_COUNT_THRESHOLDto 50 - Large facilities only: Increase
MINIMUM_COUNT_THRESHOLDto 200+
DQA indicator selection
# Core indicators used for DQA scoring (default)DQA_INDICATORS <- c("anc1", "penta1", "opd")
# Consistency pairs to evaluate (default)CONSISTENCY_PAIRS_USED <- c("penta", "anc", "delivery")
DQA_INDICATORS accepted values (from the platform parameter): any subset of c("anc1", "penta1", "opd").
CONSISTENCY_PAIRS_USED accepted values (from the platform parameter): any subset of c("penta", "anc", "delivery", "malaria").
Consistency benchmark ranges
all_consistency_ranges <- list( pair_penta = c(lower = 0.95, upper = Inf), # Penta1 >= 0.95 * Penta3 pair_anc = c(lower = 0.95, upper = Inf), # ANC1 >= 0.95 * ANC4 pair_delivery = c(lower = 0.7, upper = 1.3), # 0.7 <= BCG/Delivery <= 1.3 pair_malaria = c(lower = 0.9, upper = 1.1) # Malaria indicators within 10%)The ranges reflect programmatic expectations. For example, ANC1 should always be at least 95% of ANC4 (more women start care than complete four visits). The 5% tolerance accounts for data entry variations. BCG, as a birth dose vaccine, should approximately equal facility deliveries, with 30% tolerance for variation.
Input/output specifications
Section titled “Input/output specifications”Input file structure
Section titled “Input file structure”Required file: hmis_[COUNTRY_ISO3].csv
Required columns:
facility_id(character/integer): Unique identifier for each health facilityperiod_id(integer): Time period in YYYYMM format (e.g., 202401 for January 2024)indicator_common_id(character): Standardized indicator names (e.g., “penta1”, “anc1”, “opd”)count(numeric): Service volume or count for the indicatoradmin_area_1throughadmin_area_8(character): Geographic/administrative area columns
Format example:
facility_id,period_id,indicator_common_id,count,admin_area_1,admin_area_2,admin_area_3FAC001,202401,penta1,45,Country_A,Province_A,District_AFAC001,202401,anc1,67,Country_A,Province_A,District_AFAC001,202402,penta1,52,Country_A,Province_A,District_AData requirements:
- At least 12 months of data recommended for robust outlier detection
- Missing values represented as NA or absent rows (both handled)
- Zero counts should be explicit zeros, not missing
- Geographic columns detected automatically (columns 2-8 are optional)
Output files
Section titled “Output files”M1_output_outlier_list.csv - Flagged outliers only
Purpose: Quick reference list of only the observations flagged as outliers
Columns:
facility_id: Facility identifieradmin_area_[2-8]: Geographic areas (dynamically included based on data)indicator_common_id: Health indicator nameperiod_id: Time period (YYYYMM)count: Reported service volume
Use case: Data managers reviewing specific outliers for investigation or correction
M1_output_outliers.csv - All records with outlier flags
Purpose: Complete dataset with outlier flags for all facility-indicator-period combinations
Columns:
facility_id: Facility identifieradmin_area_[2-8]: Geographic areas (dynamically included based on data)period_id: Time period (YYYYMM)indicator_common_id: Health indicator nameoutlier_flag: Final combined outlier flag (0 = not outlier, 1 = outlier)
Use case:
- Input for Module 2 (Data Quality Adjustments)
- Statistical analysis of outlier patterns
- Generating visualizations of outlier prevalence
M1_output_completeness.csv - Completeness status
Purpose: Completeness flags for all facility-indicator-period combinations, including explicitly created records for missing months
Columns:
facility_id: Facility identifieradmin_area_[2-8]: Geographic areas (dynamically included based on data)indicator_common_id: Health indicator nameperiod_id: Time period (YYYYMM)completeness_flag: 0=Incomplete (missing), 1=Complete (reported)
Special features:
- Contains explicit rows for non-reporting months
- Inactive periods (6+ months at start/end with completeness_flag=2) excluded from export
- Full time series for each facility-indicator combination
Use case:
- Calculating completeness percentages
- Identifying reporting gaps
- Trend analysis of reporting behavior
M1_output_consistency_geo.csv - Geographic-level consistency
Purpose: Consistency flags calculated at the specified geographic level (e.g., district)
Columns:
admin_area_[2-8]: Geographic identifiers up to specified GEOLEVEL (dynamically included based on data)period_id: Time period (YYYYMM)ratio_type: Name of consistency pair (e.g., “pair_penta”, “pair_anc”)sconsistency: Binary flag (1=consistent, 0=inconsistent, NA=cannot calculate)
Format: Long format with one row per geographic area-period-ratio type
Use case:
- Understanding district-level service delivery patterns
- Identifying geographic areas with consistency issues
- Creating consistency heatmaps by zone
M1_output_dqa.csv - final DQA scores
Purpose: Composite data quality scores by facility and time period
Columns:
facility_id: Facility identifieradmin_area_[2-8]: Geographic areas (dynamically included based on data)period_id: Time period (YYYYMM)dqa_mean: Average of component scores (0-1)dqa_score: Binary overall pass/fail (1 = all checks pass; 0 = any check failed)
Use case:
- Filtering data for subsequent modules (e.g., only use facility-months with dqa_score=1)
- Tracking data quality trends over time
- Identifying facilities needing data quality improvement support
Key functions documentation
Section titled “Key functions documentation”load_and_preprocess_data()
Signature: load_and_preprocess_data(file_path)
Purpose: Loads HMIS data and prepares it for analysis by creating necessary date fields and composite indicators
Parameters:
file_path(character): Path to HMIS CSV file
Returns: List containing:
data: Preprocessed dataframe with date field addedgeo_cols: Vector of detected geographic column names
Process:
- Reads CSV file with HMIS data
- Converts
period_id(YYYYMM format) to Date objects for temporal ordering - Detects all administrative area columns (admin_area_1 through admin_area_8)
- Creates composite malaria indicator if component indicators exist:
- Combines
rdt_positive+micro_positiveintordt_positive_plus_micro - This composite is used for malaria consistency checks
- Combines
Example:
inputs <- load_and_preprocess_data("hmis_ISO3.csv")data <- inputs$datageo_cols <- inputs$geo_colsvalidate_consistency_pairs()
Signature: validate_consistency_pairs(consistency_params, data)
Purpose: Validates that required indicator pairs exist in the dataset before running consistency analysis
Parameters:
consistency_params: List containing consistency_pairs and consistency_rangesdata: The HMIS dataset
Returns: Updated consistency_params with only valid pairs (empty list if no valid pairs)
Process:
- Checks which indicators are available in the dataset
- Removes consistency pairs where one or both indicators are missing
- Issues warnings about removed pairs
- Returns empty list if no valid pairs remain
Example output:
Warning: Skipping pair_delivery - indicator 'delivery' not found in dataWarning: Skipping pair_malaria - indicator 'rdt_positive_plus_micro' not found in dataRemaining consistency pairs: pair_penta, pair_ancoutlier_analysis()
Signature: outlier_analysis(data, geo_cols, outlier_params)
Purpose: Identifies statistical outliers in facility service volumes using dual detection methods
Parameters:
data: HMIS data with facility_id, indicator_common_id, period_id, countgeo_cols: Vector of geographic column namesoutlier_params: List containing:outlier_pc_threshold: Proportion threshold (default 0.8)count_threshold: Minimum count threshold (default 100)
Returns: Dataframe with outlier flags and diagnostic metrics for each facility-indicator-period
Calculated fields:
median_volume: Median count by facility-indicatormad_volume: MAD calculated on values >= medianmad_residual: Standardized residual (|count - median| / MAD)outlier_mad: Binary flag (1 if mad_residual > MADS)pc: Proportional contribution to the trailing 12-month total (rolling window ending at the row’s period)outlier_pc: Binary flag (1 if pc > threshold)outlier_flag: Final flag (1 if either method flags AND count > minimum threshold)
Algorithm steps:
Step 1: Calculate median volume for each facility-indicator combination
Step 2: Compute MAD using only values equal to or above the median
- Avoids bias from facilities with many low-volume months
- Standardizes residuals by dividing (count - median) by MAD
- Flags outlier_mad = 1 if mad_residual > MADS parameter
Step 3: Calculate proportional contribution
- For each facility-indicator-period, sum the count over the trailing 12 months ending at that period (rolling window)
- Calculate pc = count / window_total (pc is NA if the window total is 0)
- Flags outlier_pc = 1 if pc > OUTLIER_PROPORTION_THRESHOLD
- This rolling-window denominator replaces a calendar-year denominator, which falsely flagged facilities whose only reporting fell early in a calendar year (their single month was its own denominator)
Step 4: Combine flags
- Final outlier_flag = 1 if (outlier_mad = 1 OR outlier_pc = 1) AND count > MINIMUM_COUNT_THRESHOLD
- The threshold (default 100) ensures only substantial volumes are flagged, avoiding false positives at low-volume facilities
process_completeness()
Signature: process_completeness(outlier_data_main)
Purpose: Main orchestration function that generates complete time series and assigns completeness flags for all indicators
Parameters:
outlier_data_main: Outlier analysis results (contains all facility-indicator-period combinations with counts)
Returns: Long format dataset with completeness flags for all facility-indicator-period combinations
Process:
- Identifies first and last reporting period for each indicator globally
- Calls
generate_full_series_per_indicator()for each indicator - Applies completeness tagging logic (complete/incomplete/inactive)
- Merges with geographic metadata
- Combines results across all indicators
- Removes inactive periods (completeness_flag = 2)
Output structure:
- Explicit rows for both reported and non-reported periods
- Completeness flag: 0 (incomplete), 1 (complete), 2 (inactive - removed)
- Full time series from first to last reporting period per indicator
generate_full_series_per_indicator()
Signature: generate_full_series_per_indicator(outlier_data, indicator_id, timeframe)
Purpose: Creates a complete monthly time series for a specific indicator, filling in gaps where facilities did not report
Parameters:
outlier_data: data.table with outlier resultsindicator_id: Specific indicator to process (e.g., “penta1”)timeframe: Data table with first_pid and last_pid for each indicator
Returns: Complete time series with explicit rows for both reported and non-reported periods
Process:
- Subsets data to specific indicator
- Generates monthly sequence from first to last period_id for that indicator
- Creates complete facility-period grid (all facilities × all months) using
CJ()cross join - Merges with actual reported data
- Missing counts indicate non-reporting periods
- Applies inactive detection algorithm
Inactive detection algorithm:
# A facility is flagged inactive (offline_flag = 2) if:# 1. Missing 6+ consecutive months BEFORE first report, OR# 2. Missing 6+ consecutive months AFTER last report
offline_flag := fifelse(  (missing_group == 1 & missing_count >= 6 & !first_report_idx) |  (missing_group == max(missing_group) & missing_count >= 6 & !last_report_idx),  2L, 0L)
Example timeline:
Facility A reporting pattern for indicator "penta1":Period:  202001 202002 202003 202004 202005 202006 202007 202008 202009 202010Count:   NA     NA     NA     NA     50     30     NA     NA     40     35Flag:    2      2      2      2      1      1      0      0      1      1         [----Inactive----] [---Active period with gaps---]
Explanation:- First 4 months: Inactive (6+ months missing before first report at 202005)- 202005-202006: Complete (reported)- 202007-202008: Incomplete (gaps in active period)- 202009-202010: Complete (reported)
geo_consistency_analysis()
Signature: geo_consistency_analysis(data, geo_cols, geo_level, consistency_params)
Purpose: Calculates consistency ratios at the geographic level to account for patients seeking services across multiple facilities within a district/ward
Parameters:
data: Outlier data (with outliers already flagged)geo_cols: Vector of geographic column namesgeo_level: Geographic level for aggregation (e.g., “admin_area_3”)consistency_params: List with consistency_pairs and consistency_ranges
Returns: Long format dataframe with geographic-level consistency results
Process:
- Excludes outliers (sets count to NA where outlier_flag = 1)
- Aggregates data to specified geographic level by period (sums across facilities)
- Reshapes to wide format (one column per indicator)
- Calculates ratio for each indicator pair
- Flags consistency based on predefined ranges
Output columns:
- Geographic identifiers (up to specified level)
period_id: Time periodratio_type: Name of the consistency pair (e.g., “pair_penta”)consistency_ratio: Calculated ratio valuesconsistency: Binary flag (1 = consistent, 0 = inconsistent, NA = cannot calculate)
Example output:
admin_area_2 admin_area_3 period_id ratio_type consistency_ratio sconsistencyDistrict_A Ward_1 202401 pair_penta 1.05 1District_A Ward_1 202401 pair_anc 0.88 0District_A Ward_2 202401 pair_penta 0.97 1Rationale: Measuring consistency at the geographic level accounts for patient movement between facilities and provides a more accurate picture of service utilization patterns across a community.
expand_geo_consistency_to_facilities()
Signature: expand_geo_consistency_to_facilities(facility_metadata, geo_consistency_results, geo_level)
Purpose: Assigns geographic-level consistency results to individual facilities
Parameters:
facility_metadata: Facility list with geographic assignmentsgeo_consistency_results: Output from geo_consistency_analysis()geo_level: Geographic level used in consistency analysis
Returns: Facility-level dataset with consistency flags
Process:
- Extracts facility list with their geographic assignments
- Performs left join to replicate geo-level consistency scores to all facilities in that area
- Uses many-to-many relationship to handle multiple periods and ratio types
Rationale: Since consistency is measured at the geographic level (accounting for patient movement between facilities), all facilities within the same district/ward receive the same consistency scores.
dqa_with_consistency()
Signature: dqa_with_consistency(completeness_data, consistency_data, outlier_data, geo_cols, dqa_rules)
Purpose: Calculates comprehensive DQA scores including consistency checks when consistency pairs are available
Parameters:
completeness_data: Output from process_completeness()consistency_data: Wide-format facility consistency resultsoutlier_data: Output from outlier_analysis()geo_cols: Vector of geographic column namesdqa_rules: List specifying required values for each dimension
DQA Rules Configuration:
dqa_rules <- list( completeness = 1, # Must be complete (flag = 1) outlier_flag = 0, # Must NOT be an outlier (flag = 0) sconsistency = 1 # Must be consistent (flag = 1))Scoring algorithm:
1. Completeness-Outlier Score (per facility-period):
- Each DQA indicator scores 0-2 points (1 for completeness + 1 for no outlier)
- Maximum possible = 2 × number of DQA indicators
- Score = Total Points / Maximum Points
2. Consistency Score (per facility-period):
- Only counts pairs where both indicators exist (NA pairs excluded from denominator)
- Score = Number of passing pairs / Number of available pairs
- If no pairs available, score = 0
3. Mean DQA Score:
- Average of completeness-outlier score and consistency score
- Formula:
(completeness_outlier_score + consistency_score) / 2
4. Binary DQA Score:
- 1 if all checks pass (complete, no outliers, consistent)
- 0 if any check fails
Handling missing indicators: The function intelligently handles cases where some consistency indicators are missing:
- NA values in consistency pairs are NOT replaced with 0
- Only available pairs contribute to the denominator
- This prevents penalizing facilities for indicators they do not provide
Example calculation:
Facility X in period 202401:- DQA Indicators: penta1, anc1, opd (3 indicators)- Completeness: All 3 complete → 3 points- Outliers: None → 3 points- Total: 6/6 → completeness_outlier_score = 1.0
Consistency Pairs:- pair_penta (penta1/penta3): Pass (1)- pair_anc (anc1/anc4): Fail (0)- pair_delivery: NA (bcg not a DQA indicator)
Consistency calculation:- Available pairs: 2 (penta, anc)- Passing pairs: 1 (penta)- consistency_score = 1/2 = 0.5
Final scores:- dqa_mean = (1.0 + 0.5) / 2 = 0.75- dqa_score = 0 (not all pairs passed)
dqa_without_consistency()
Signature: dqa_without_consistency(completeness_data, outlier_data, geo_cols, dqa_rules)
Purpose: Calculates DQA scores using only completeness and outlier checks when consistency data is unavailable or no valid consistency pairs exist
When used:
- No consistency pairs defined in configuration
- All consistency pairs have missing indicators
- Dataset does not contain paired indicators
Scoring:
- Uses only completeness and outlier components
dqa_mean=completeness_outlier_scoredqa_score= 1 if all completeness and outlier checks pass, 0 otherwise
Output structure:
dqa_results <- data.frame( facility_id, admin_area_X, # Dynamic geographic columns period_id, completeness_outlier_score, # Range: 0-1 dqa_mean, # Range: 0-1 (equals completeness_outlier_score) dqa_score # Binary: 0 or 1)Statistical methods & algorithms
Section titled “Statistical methods & algorithms”Median absolute deviation (MAD) calculation
The MAD is a robust measure of variability that is less sensitive to outliers than standard deviation.
Standard MAD Algorithm:
- Compute the median of the dataset
- Calculate absolute deviations: |value - median| for each data point
- Find the median of these absolute deviations
FASTR Modification: The module calculates MAD using only values at or above the median, making it more sensitive to high outliers while avoiding bias from facilities with many low-volume months.
Outlier degree calculation:
$$ \text{MAD Residual} = \frac{|\text{volume} - \text{median volume}|}{\text{MAD}} $$
Outlier classification:
- If MAD Residual > 10 (configurable via
MADSparameter), the value is flagged as a MAD-based outlier (outlier_mad = 1) - The final
outlier_flagalso requires count > 100
Example:
Facility ABC, Indicator: penta1Monthly counts: 20, 25, 22, 28, 24, 26, 150, 23, 27, 25, 21, 24
Step 1: Calculate median = 24.5Step 2: Values >= median: 25, 28, 24.5, 26, 150, 27, 25, 24.5Step 3: Absolute deviations from median: 0.5, 3.5, 0, 1.5, 125.5, 2.5, 0.5, 0Step 4: MAD = median(0, 0, 0.5, 0.5, 1.5, 2.5, 3.5, 125.5) = 1.0Step 5: For count=150: MAD residual = |150 - 24.5| / 1.0 = 125.5Step 6: 125.5 > 10 AND 150 > 100, therefore outlier_flag = 1
Proportional outlier detection
This method identifies months where a single observation represents an unusually large proportion of the facility-indicator’s reported volume over the preceding 12 months.
Algorithm:
- For each facility-indicator-period, sum the count over the trailing 12 months ending at that period (rolling window per facility × indicator)
- Calculate the proportion:
pc = monthly_count / window_total(set to NA if the window total is 0) - Flag as proportional outlier (
outlier_pc = 1) ifpc > OUTLIER_PROPORTION_THRESHOLD(default 0.8) - The final
outlier_flagalso requires count > 100
Rationale: A facility reporting 80% of its trailing-year volume in a single month likely indicates a data entry error (e.g., cumulative reporting instead of monthly, extra digit entered). The trailing 12-month window replaces an earlier calendar-year denominator: a facility whose only reporting fell early in a calendar year was previously its own denominator (pc ≈ 1.0) and was incorrectly flagged.
Example:
Facility XYZ, Indicator: anc1Monthly counts (Jun 2023 – May 2024):  Jun  Jul  Aug  Sep  Oct  Nov  Dec  Jan  Feb  Mar  Apr  May   15   18   12   16   14   17   13   16   15   14   12  890
For May 2024 (count=890):window_total = 15+18+12+16+14+17+13+16+15+14+12+890 = 1052pc = 890 / 1052 = 0.8460.846 > 0.8 AND 890 > 100, therefore outlier_flag = 1
Consistency ratio benchmarks
The module applies programmatically defined benchmarks for indicator pairs:
ANC Consistency:
$$ \text{ANC Consistency} = \begin{cases} 1, & \frac{\text{ANC1 Volume}}{\text{ANC4 Volume}} \geq 0.95 \ 0, & \text{otherwise} \end{cases} $$
Interpretation: More women should start ANC (ANC1) than complete four visits (ANC4). The ratio is expected to be ≥ 0.95, allowing up to 5% tolerance for data variations.
Penta consistency:
$$ \text{Penta Consistency} = \begin{cases} 1, & \frac{\text{Penta1 Volume}}{\text{Penta3 Volume}} \geq 0.95 \ 0, & \text{otherwise} \end{cases} $$
Interpretation: More children should receive Penta1 than complete the three-dose series (Penta3).
BCG/Delivery Consistency:
$$ \text{BCG/Delivery Consistency} = \begin{cases} 1, & 0.7 \leq \frac{\text{BCG Volume}}{\text{Delivery Volume}} \leq 1.3 \ 0, & \text{otherwise} \end{cases} $$
Interpretation: BCG is a birth dose vaccine, so BCG vaccinations should approximately equal facility deliveries. The wider range (±30%) accounts for infants born elsewhere receiving BCG at the facility or facility-born infants receiving BCG elsewhere.
Implementation detail:
Consistency is assessed at the district/ward level (specified by GEOLEVEL) to account for patients visiting multiple facilities within their local area for different services.
Completeness calculation
For a given indicator in a given month:
$$ \text{Completeness} = \frac{\text{Number of reporting facilities}}{\text{Number of expected facilities}} \times 100 $$
Expected facilities definition: A facility is expected to report for an indicator if it has ever reported for that indicator within the analysis timeframe AND is not flagged as inactive.
Inactive facility definition: A facility is flagged as inactive for periods where it did not report for six or more consecutive months before its first report or after its last report.
Example:
District has 20 facilities that have ever reported penta1 data in 2024In March 2024:- 18 facilities submitted penta1 data- 2 facilities did not submit (but are not inactive)
Completeness = 18 / 20 × 100 = 90%
Important note: A high level of completeness does not necessarily indicate that the HMIS is representative of all service delivery in the country, as some services may not be delivered in facilities or some facilities may not report. For countries where DHIS2 does not store zeros, indicator completeness may be underestimated if there are many low-volume facilities.
DQA composite score calculation
The DQA score combines three quality dimensions for a defined set of core indicators.
Component scores:
1. Completeness-Outlier Score:
$$ \text{Completeness-Outlier Score} = \frac{\sum (\text{completeness pass} + \text{outlier pass})}{2 \times \text{number of DQA indicators}} $$
2. Consistency Score:
$$ \text{Consistency Score} = \frac{\text{Number of pairs passing benchmarks}}{\text{Number of available pairs}} $$
3. Mean DQA Score:
$$ \text{DQA Mean} = \frac{\text{Completeness-Outlier Score} + \text{Consistency Score}}{2} $$
4. Binary DQA Score:
$$ \text{DQA Score} = \begin{cases} 1, & \text{if all checks pass (complete, no outliers, consistent)} \ 0, & \text{if any check fails} \end{cases} $$
Passing criteria for binary score:
- ALL DQA indicators must be complete (completeness_flag = 1)
- ALL DQA indicators must be free of outliers (outlier_flag = 0)
- ALL available consistency pairs must pass benchmarks (sconsistency = 1)
Example calculation:
Facility 123, Period 202403DQA Indicators: penta1, anc1, opd
Completeness: penta1=1, anc1=1, opd=1 → 3 pointsOutliers: penta1=0, anc1=0, opd=0 → 3 pointsCompleteness-Outlier Score = 6 / (2×3) = 1.0
Consistency Pairs:- pair_penta: 1 (pass)- pair_anc: 1 (pass)Consistency Score = 2 / 2 = 1.0
DQA Mean = (1.0 + 1.0) / 2 = 1.0DQA Score = 1 (all checks passed)
Code examples
Section titled “Code examples”Example 1: Running the module with default settings
# Set working directorysetwd("/path/to/module/directory")
# Load required librarieslibrary(zoo)library(stringr)library(dplyr)library(tidyr)library(data.table)
# The module will automatically:# 1. Load hmis_ISO3.csv# 2. Run all analyses with default parameters# 3. Generate output CSV files in the working directory
source("01_module_data_quality_assessment.R")
Example 2: Adjusting outlier detection sensitivity
# Make outlier detection more sensitive (lower thresholds)OUTLIER_PROPORTION_THRESHOLD <- 0.6   # Flag if >60% of trailing 12-month volume (was 80%)MINIMUM_COUNT_THRESHOLD <- 50         # Consider counts >=50 (was 100)MADS <- 8                             # Flag at 8 MADs (was 10)
# Run the modulesource("01_module_data_quality_assessment.R")
Use case: Countries with generally low service volumes where the default thresholds are too conservative.
Example 3: Different geographic level for consistency
# Use district level (admin_area_2) instead of sub-district (admin_area_3)GEOLEVEL <- "admin_area_2"
# This affects consistency analysis aggregation levelsource("01_module_data_quality_assessment.R")
Use case: Sub-district level has sparse data or too few facilities per area, making district-level aggregation more stable.
Example 4: custom DQA indicators
# Focus DQA on maternal health indicators onlyDQA_INDICATORS <- c("anc1", "anc4", "delivery", "pnc1")
# Only evaluate anc consistency pairCONSISTENCY_PAIRS_USED <- c("anc")
source("01_module_data_quality_assessment.R")
Use case: Specialized analysis focusing on a specific service area.
Example 5: Running for different country
# Configure for your countryCOUNTRY_ISO3 <- "ISO3"  # Replace with your country codePROJECT_DATA_HMIS <- "hmis_ISO3.csv"GEOLEVEL <- "admin_area_3"
# Adjust for country-specific indicators if neededDQA_INDICATORS <- c("penta1", "anc1", "opd", "fp_new")
source("01_module_data_quality_assessment.R")
Example 6: Programmatic use of outputs
# After running the module, work with outputs
# Load DQA resultsdqa_results <- read.csv("M1_output_dqa.csv")
# Filter to high-quality facility-months onlyhigh_quality <- dqa_results %>%  filter(dqa_score == 1)
# Calculate percentage of facility-months passing DQA by districtquality_by_district <- dqa_results %>%  group_by(admin_area_2, period_id) %>%  summarize(    total_facility_months = n(),    passing_quality = sum(dqa_score == 1),    pct_passing = 100 * passing_quality / total_facility_months  )
# Identify facilities with consistently poor quality (never passing)poor_quality_facilities <- dqa_results %>%  group_by(facility_id) %>%  summarize(    months_analyzed = n(),    months_passed = sum(dqa_score == 1),    pct_passed = 100 * months_passed / months_analyzed  ) %>%  filter(pct_passed == 0)
Troubleshooting
Section titled “Troubleshooting”Problem: Module skips consistency analysis
Symptoms:
- Console message: “No valid consistency pairs found”
- M1_output_consistency_geo.csv has only headers
- DQA scores calculated without consistency component
Diagnosis: Check that both indicators in each pair exist in your dataset:
# Load your datadata <- read.csv("hmis_[COUNTRY].csv")
# Check available indicatorsprint(unique(data$indicator_common_id))
# Compare with required pairs# For pair_penta: need "penta1" and "penta3"# For pair_anc: need "anc1" and "anc4"# For pair_delivery: need "bcg" and "delivery" (or "sba")
Solutions:
- Adjust
CONSISTENCY_PAIRS_USEDto only include pairs with available indicators - Modify indicator names in your data to match expected names
- Accept that DQA will be calculated without consistency component
Problem: All facilities flagged as outliers
Symptoms:
- Very high percentage of outlier_flag = 1 in M1_output_outliers.csv
- Most observations in outlier_list.csv
Diagnosis: Your thresholds may be too sensitive for your data context.
Solutions:
- Increase MAD threshold:
MADS <- 15 # Increase from default 10- Increase proportion threshold:
OUTLIER_PROPORTION_THRESHOLD <- 0.9 # Increase from 0.8- Increase minimum count threshold (focus on larger facilities):
MINIMUM_COUNT_THRESHOLD <- 200 # Increase from 100- Review the data: Check if there are genuine quality issues requiring data cleaning rather than parameter adjustment
Problem: no DQA results generated
Symptoms:
- M1_output_dqa.csv is empty or has only headers
- Console message: “Skipping DQA analysis - none of the required indicators found”
Diagnosis:
None of the indicators specified in DQA_INDICATORS exist in your dataset.
Solution: Check which DQA indicators are missing:
# Load datadata <- read.csv("hmis_[COUNTRY].csv")
# Check which DQA indicators are missingavailable_indicators <- unique(data$indicator_common_id)missing_indicators <- setdiff(DQA_INDICATORS, available_indicators)print(paste("Missing DQA indicators:", paste(missing_indicators, collapse=", ")))
# Available DQA indicatorsavailable_dqa <- intersect(DQA_INDICATORS, available_indicators)print(paste("Available DQA indicators:", paste(available_dqa, collapse=", ")))
Then update DQA_INDICATORS to include only available indicators:
DQA_INDICATORS <- c("penta1", "anc1") # Only use what's availableProblem: Consistency ratios seem incorrect
Symptoms:
- All consistency flags are 0 (inconsistent)
- Consistency ratios are unexpectedly high or low
Diagnosis: The geographic aggregation level may be inappropriate for your data.
Investigation:
# Load geographic consistency resultsgeo_cons <- read.csv("M1_output_consistency_geo.csv")
# Check distribution of consistency ratiossummary(geo_cons$consistency_ratio)
# Check sample sizes at geographic leveloutliers <- read.csv("M1_output_outliers.csv")geo_summary <- outliers %>%  group_by(admin_area_3, period_id) %>%  summarize(    n_facilities = n_distinct(facility_id),    total_volume = sum(count, na.rm = TRUE)  )summary(geo_summary$n_facilities)
Solutions:
- If geographic areas have very few facilities (1-2), use higher level:
GEOLEVEL <- "admin_area_2" # Use district instead of sub-district-
If ratios are generally below 0.95 for ANC/Penta pairs, this may indicate genuine programmatic issues (high dropout) rather than data quality problems
-
Review the consistency benchmark ranges - they may need adjustment for your context:
# Example: Allow higher dropout (lower ratio) for Pentaall_consistency_ranges$pair_penta <- c(lower = 0.85, upper = Inf)Problem: Completeness percentages seem low
Symptoms:
- High proportion of completeness_flag = 0 in M1_output_completeness.csv
Diagnosis: This could be legitimate (poor reporting) or an artifact of how your DHIS2 stores zero values.
Investigation:
# Load completeness datacompleteness <- read.csv("M1_output_completeness.csv")
# Check pattern: Are there explicit zeros or just missing values?outliers <- read.csv("M1_output_outliers.csv")table(is.na(outliers$count), outliers$count == 0)
# Check completeness by indicatorcomp_by_indicator <- completeness %>%  group_by(indicator_common_id) %>%  summarize(    pct_complete = 100 * mean(completeness_flag == 1),    pct_incomplete = 100 * mean(completeness_flag == 0)  )print(comp_by_indicator)
Considerations:
- If your DHIS2 does not store zeros, low-volume facilities may appear incomplete when they legitimately had no services to report
- Completeness percentages should be interpreted in context - 70% completeness may be acceptable depending on the health system
- Use the completeness_flag in subsequent modules to weight estimates appropriately
Problem: Error reading input file
Symptoms:
- Error: “Cannot open file ‘hmis_[COUNTRY].csv’”
- Module crashes during data loading
Solutions:
- Check file path and working directory:
getwd() # Verify working directorylist.files() # Check if HMIS file is present-
Verify file name matches
PROJECT_DATA_HMISparameter -
Check file format (CSV, proper encoding, comma-separated)
-
Ensure required columns exist:
# After loadingnames(data) # Should include: facility_id, period_id, indicator_common_id, countUsage notes
Section titled “Usage notes”Interpretation guidelines
Outlier flags:
- outlier_flag = 1 suggests potential data quality issues, but require investigation
- Not all flagged outliers are errors (genuine service campaigns can trigger flags)
- Use mad_residual and pc values to prioritize review
Completeness:
- Completeness % varies by health system context
- 80-90%+ is generally good, but depends on country
- Trend over time more informative than absolute percentage
- Low completeness for specific indicators may reflect genuine service gaps
Consistency:
- sconsistency = 0 may indicate data quality issues OR programmatic performance issues (e.g., high dropout)
- Requires programmatic knowledge to interpret
- Geographic patterns can help distinguish systematic issues from random errors
DQA Scores:
- dqa_score = 1 indicates data passed all checks, suitable for unadjusted use
- dqa_score = 0 requires further investigation
- dqa_mean provides nuanced view (0.75 = mostly good, 0.25 = mostly poor)
Choosing which outputs to review
For initial assessment:
- Start with DQA summary heatmaps to identify areas/indicators with issues
- Focus on high-volume indicators (ANC1, Penta1, Delivery) which are more reliable
- Review completeness trends over time before point estimates
For deeper investigation:
- Use outlier detail files to see specific flagged values
- Cross-reference consistency issues with programmatic knowledge
- Compare patterns across adjacent geographic areas
Priority order:
- Completeness - affects whether data represents the full picture
- Outliers - directly distort aggregate statistics
- Consistency - may indicate systemic issues or data entry problems
Limitations
Statistical limitations:
- MAD-based outlier detection assumes roughly symmetric distributions
- Consistency thresholds (98th percentile) may need context-specific tuning
- Completeness assessment requires accurate facility master list
Interpretation caveats:
- Not all flagged issues are errors (campaigns, outbreaks cause genuine spikes)
- Consistency failures may reflect programmatic issues, not data quality
- Geographic aggregations can mask facility-level variation
Data requirements:
- At least 6 months of data recommended for stable outlier detection
- Facility identifiers must be consistent across periods
- Missing geographic identifiers limit subnational analysis