
Projects
Projects are the primary workspace for analysis in FASTR. Each project brings together a results package containing pre-computed analytical outputs with the visualizations, reports, and slide decks you create from those results. You might create separate projects for different time periods, geographic regions, or program areas.
Creating a project
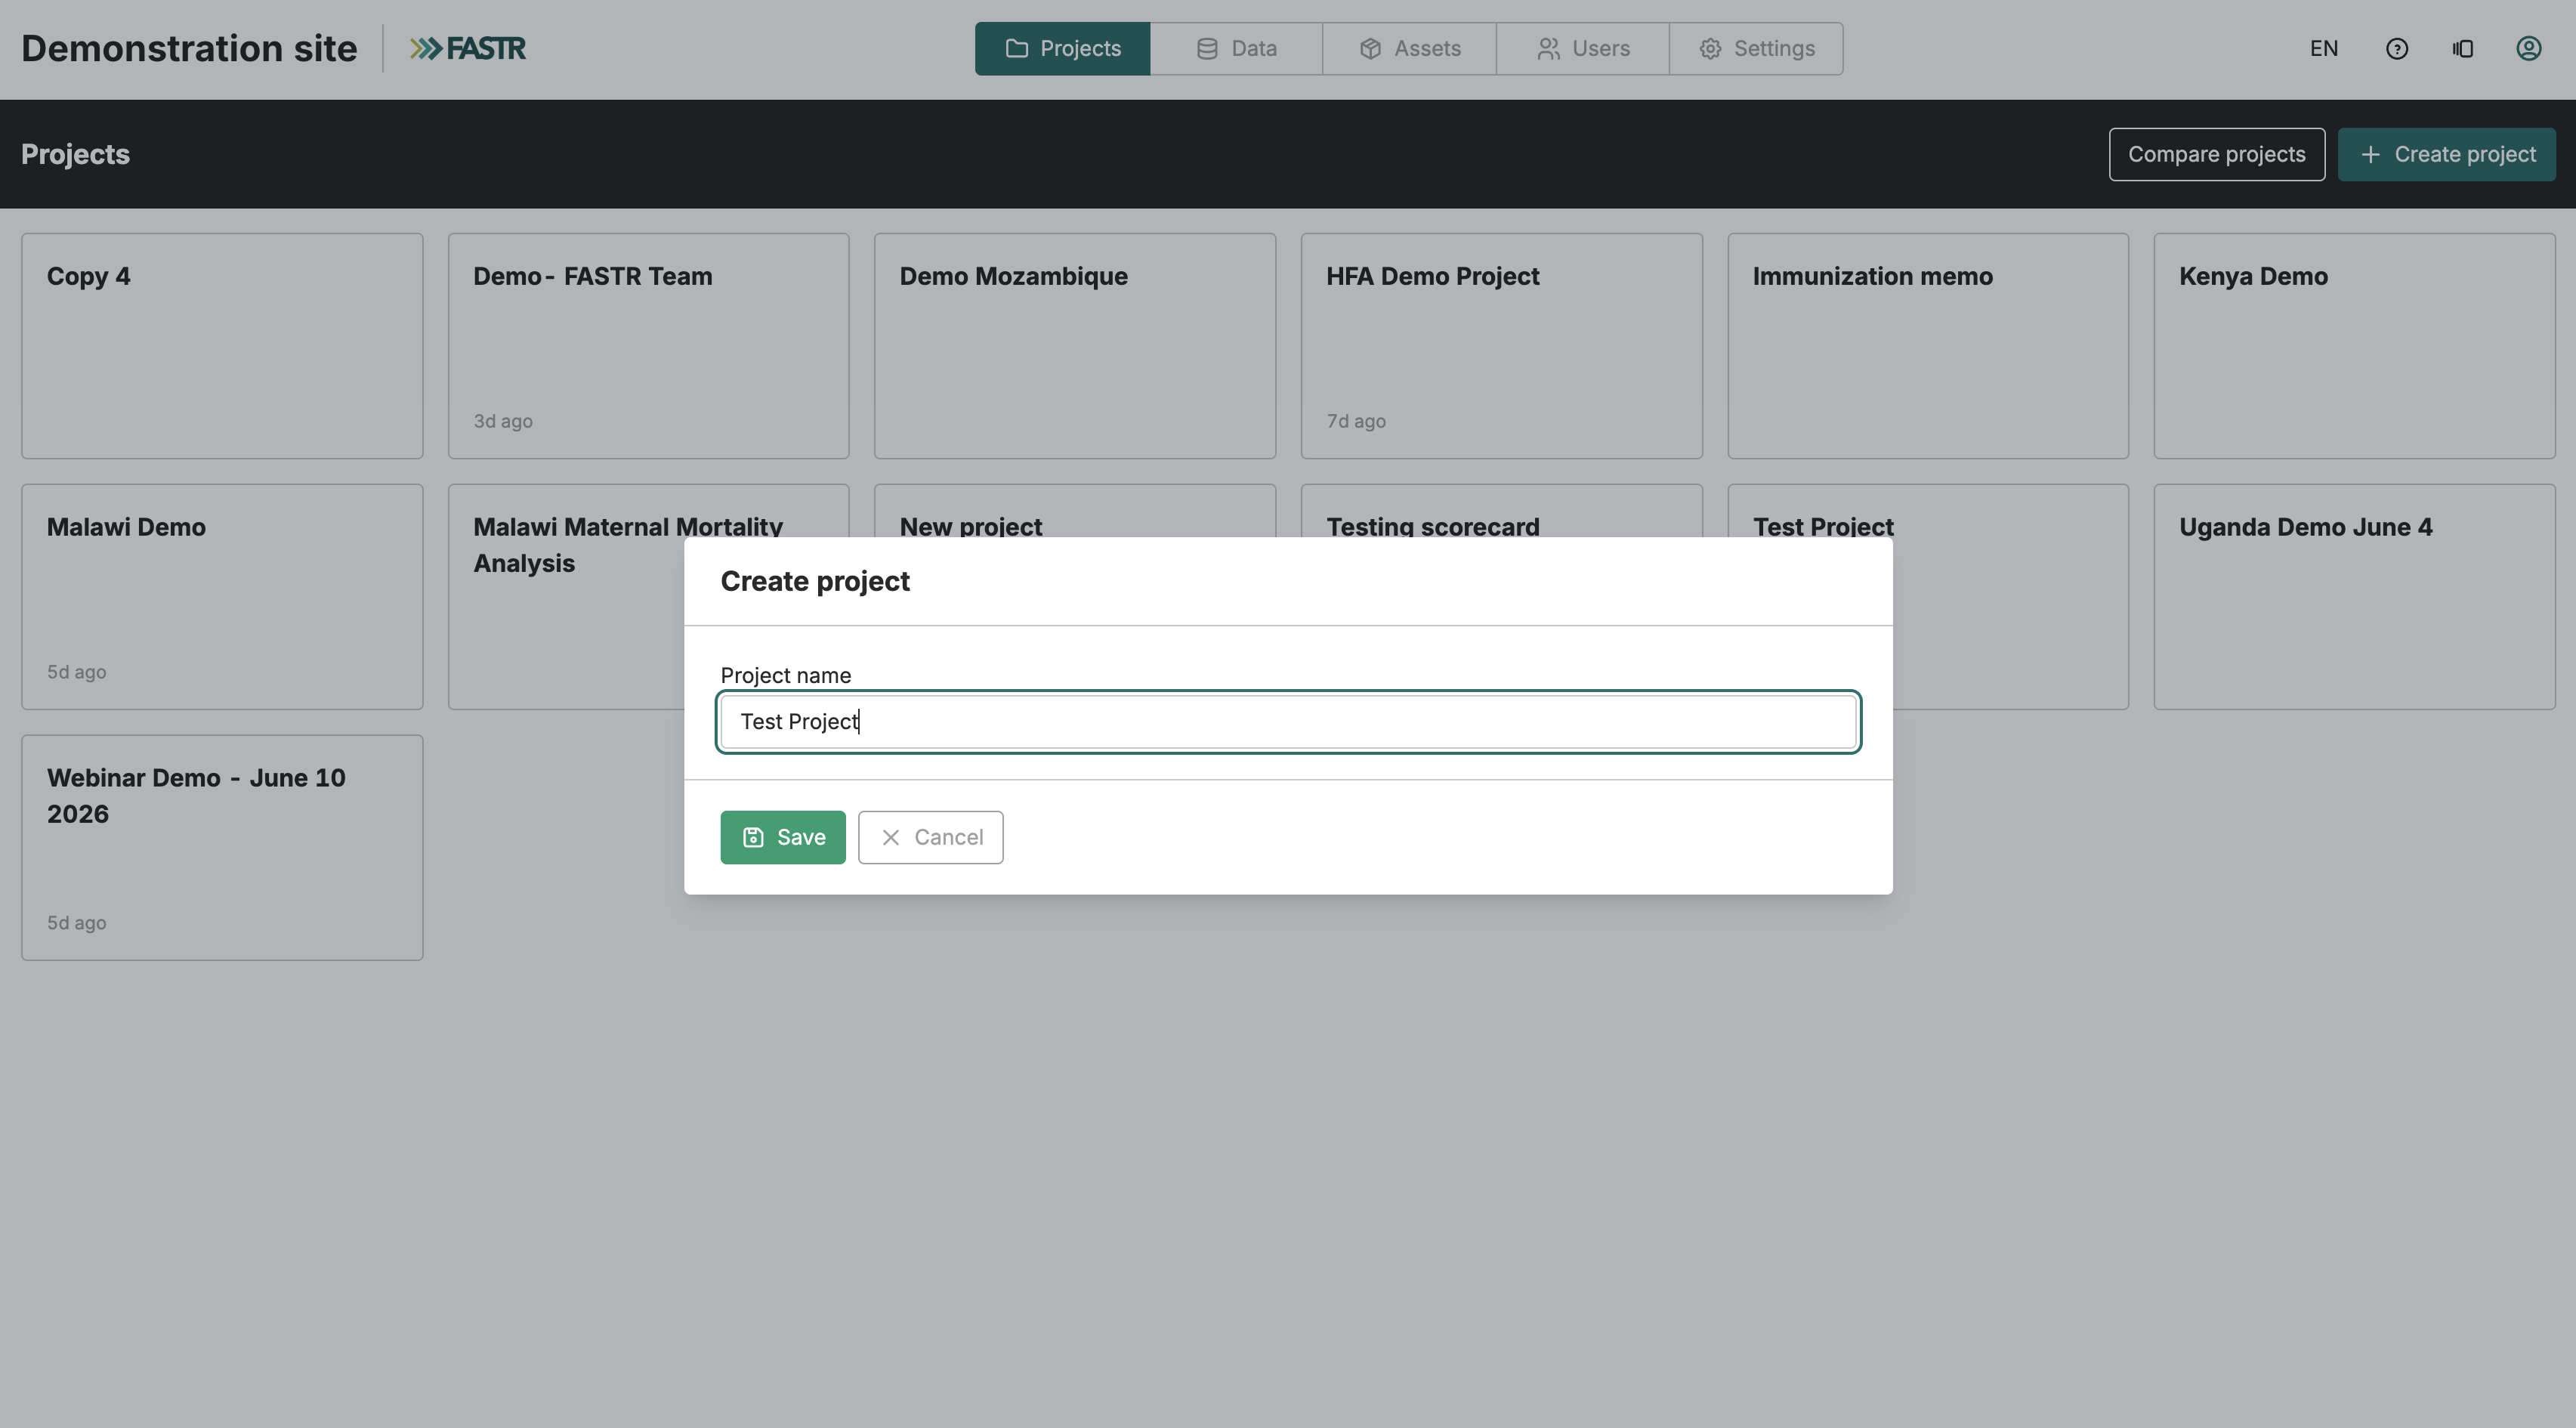
Section titled “Creating a project”Any user with the “Create projects” permission can start a new project from the home screen. Click Create project, enter a name that identifies the project’s scope, and choose a project scope — either National or a specific Admin Area 2. The scope determines how the attached results package is filtered for this project: a scoped project sees the package as if it contained only that area, while metrics with no area breakdown remain national.
New projects start without a results package attached. Your next step is to attach a results package from the Results package tab, which is where module outputs and data are made available to the project.
Attaching a results package
Section titled “Attaching a results package”A results package is generated at the instance level and contains pre-computed module outputs. To make data and analytical results available in a project, open the project and navigate to Results package in the left sidebar, then attach one of the available packages.
Editors can select any ready package from the instance using the dropdown in the package settings area. They can also enable Always use the instance’s pinned package to subscribe the project to whichever package an administrator designates as the instance pin — whenever the pin changes, the project switches automatically. Choosing a different package manually turns this subscription off.
When a project follows the pinned package but is currently on a different one, a warning appears with a Switch to pinned package button to resync it immediately.
Switching a project to a different results package changes the data behind every visualization, report, and slide deck in the project. Before a switch takes effect, FASTR shows you a compatibility report listing any visualizations that would not resolve against the new package — they stay in the project and display why they cannot be drawn. Nothing changes until you confirm.
If the project has an Admin Area 2 scope set and the selected package has no data for that area, a warning appears both in the compatibility report and on the Results package tab after attaching. Area-level metrics will show no data, but national-level metrics remain visible.
Project scope
Section titled “Project scope”Each project has a scope — either National or a specific Admin Area 2. The scope is set when creating the project and can be changed later by a global administrator from Settings. A scoped project filters the attached results package so that area-level metrics show only data for that area; national-level metrics remain visible regardless of scope. The project’s scope appears as a badge next to the project name and is shown in Settings under Project scope.
Managing project users and permissions
Section titled “Managing project users and permissions”Project access is controlled through a granular permission system. Click Settings in the left sidebar, then scroll to Project users. The table shows all instance users and their current role in this project.
FASTR organizes permissions into three categories:
- Analytical Products covers viewing and configuring visualizations, reports, and slide decks
- Data & Modules includes viewing data, metrics, and logs, plus configuring and running modules
- Project Administration handles settings, user management, and backup operations
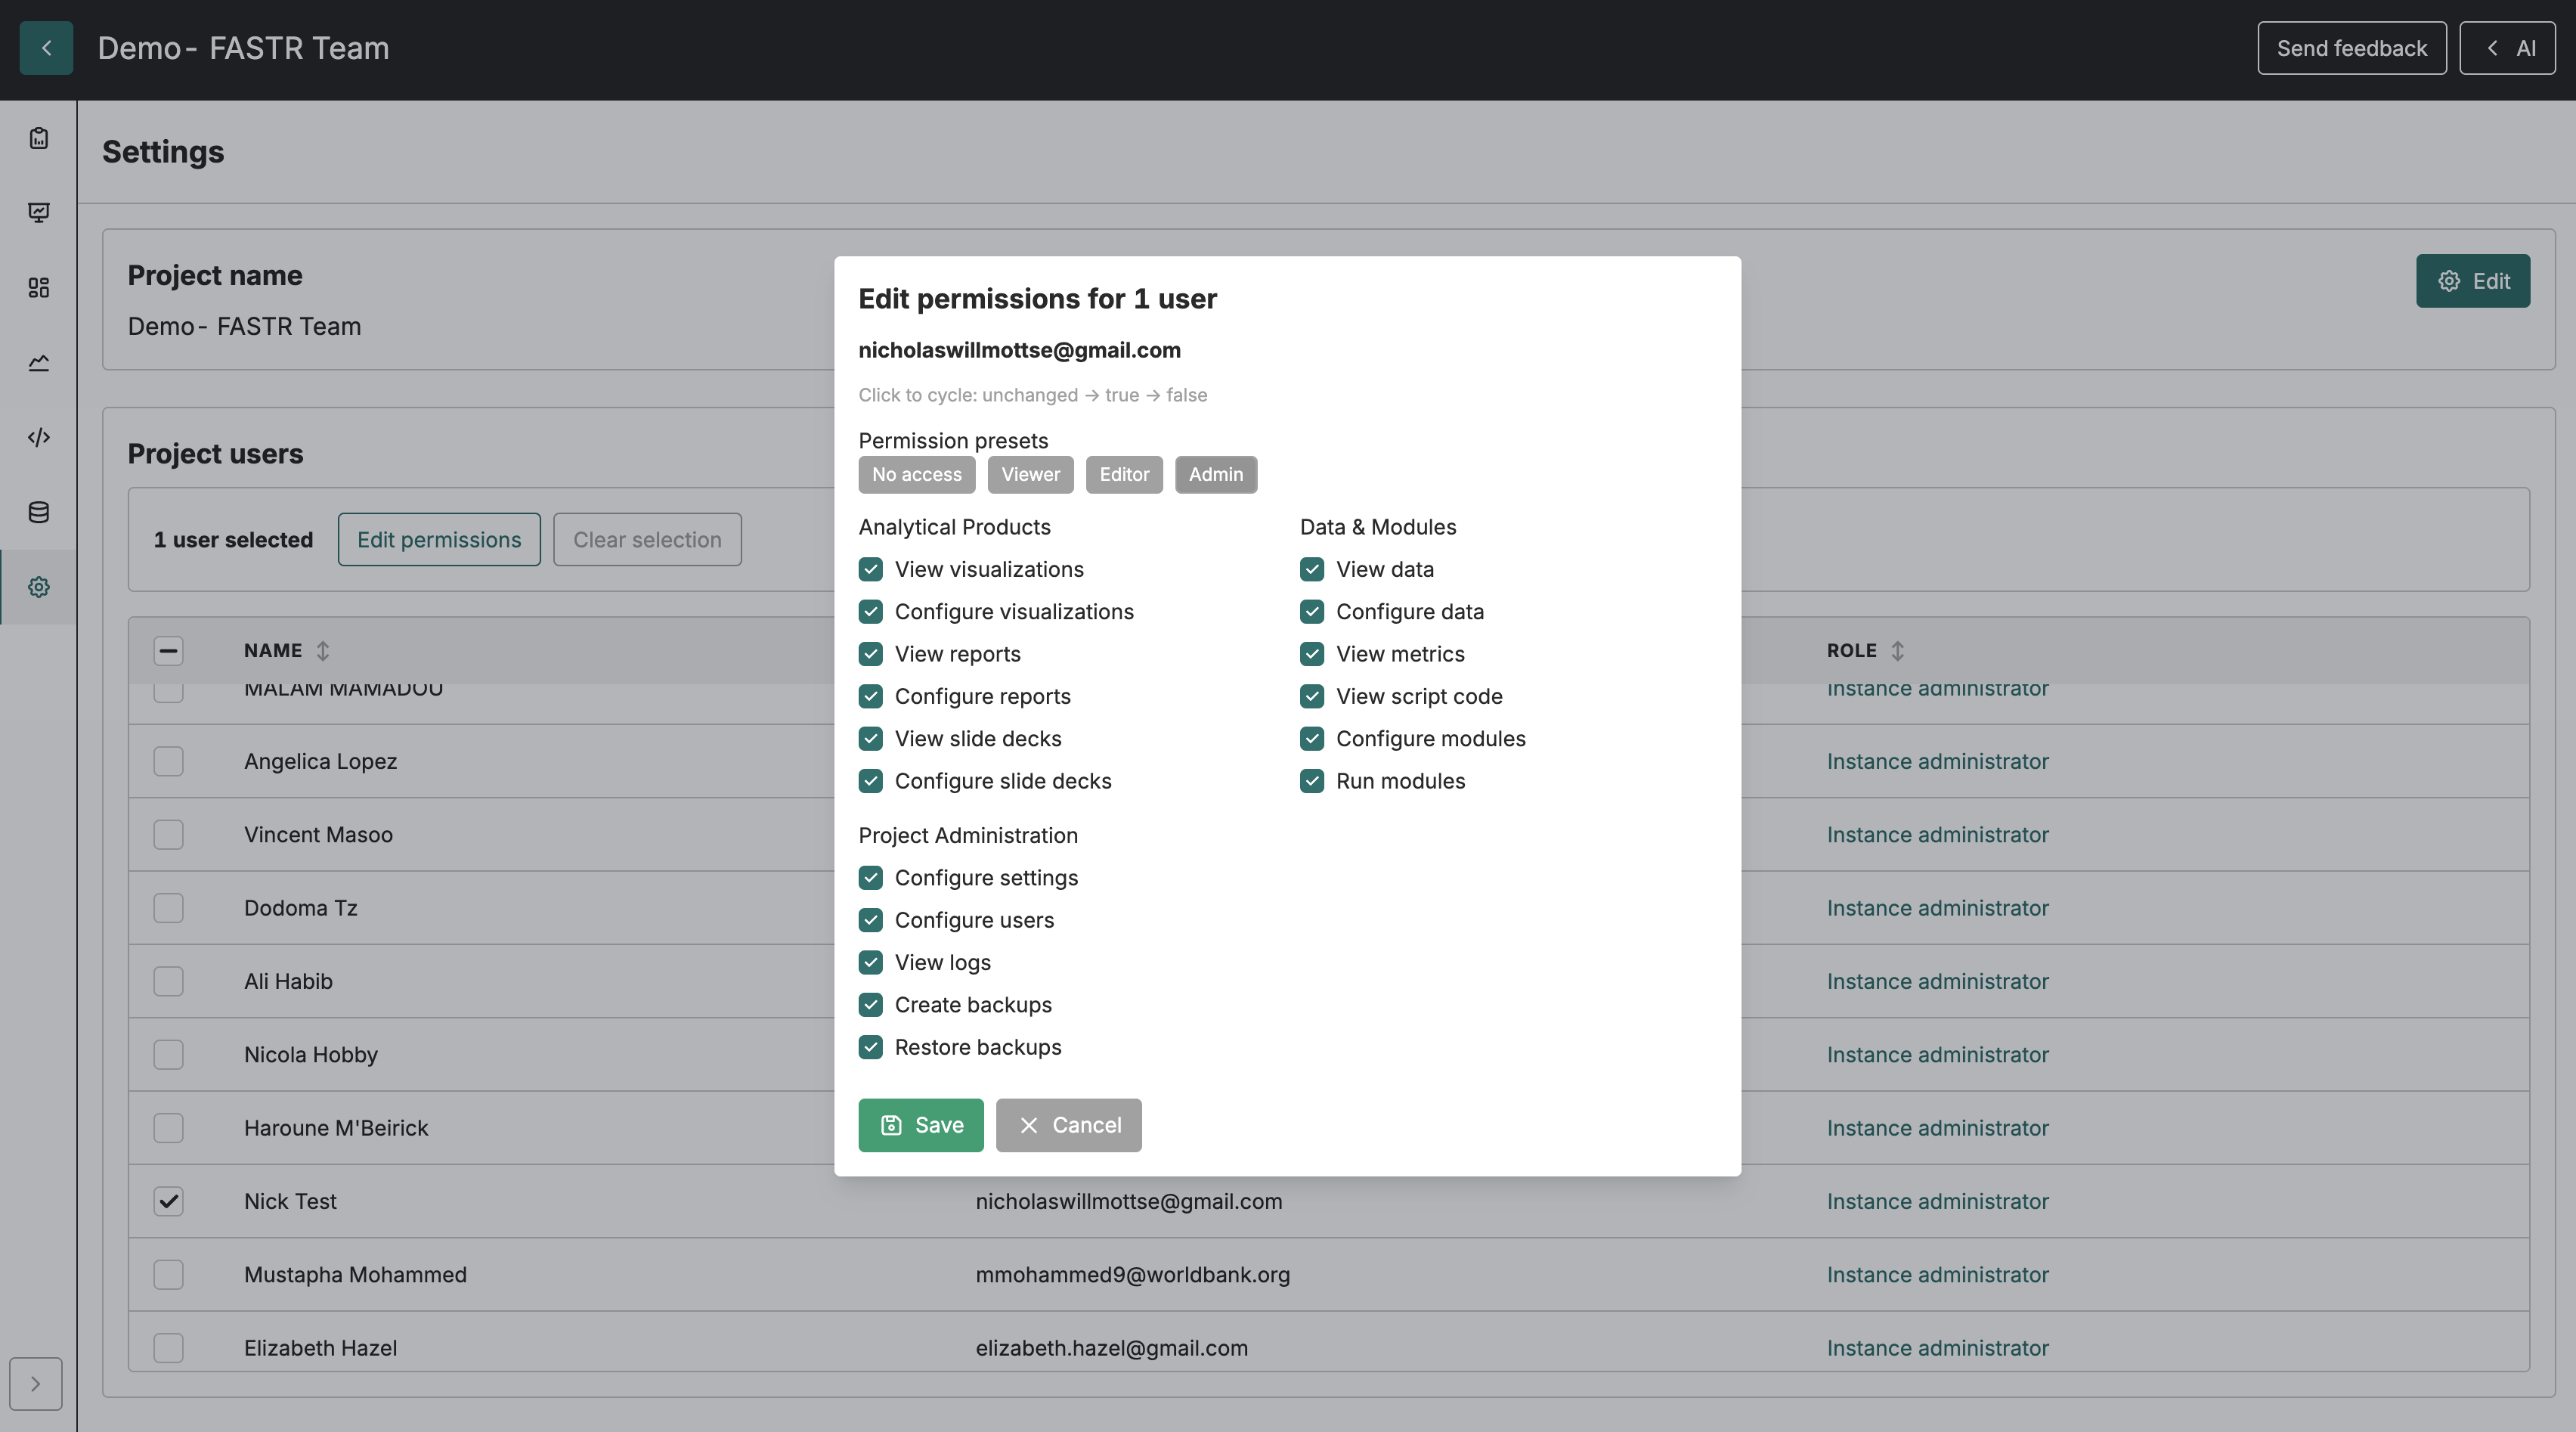
Click the edit button next to any user to modify their permissions. You can toggle individual permissions or use presets like “Viewer” or “Editor.” Instance administrators automatically have full access to all projects.
For bulk changes, select multiple users using the checkboxes, then click Edit permissions. The bulk editor uses a three-state toggle - unchanged, grant, or revoke - letting you modify specific permissions without affecting others.
Locking projects
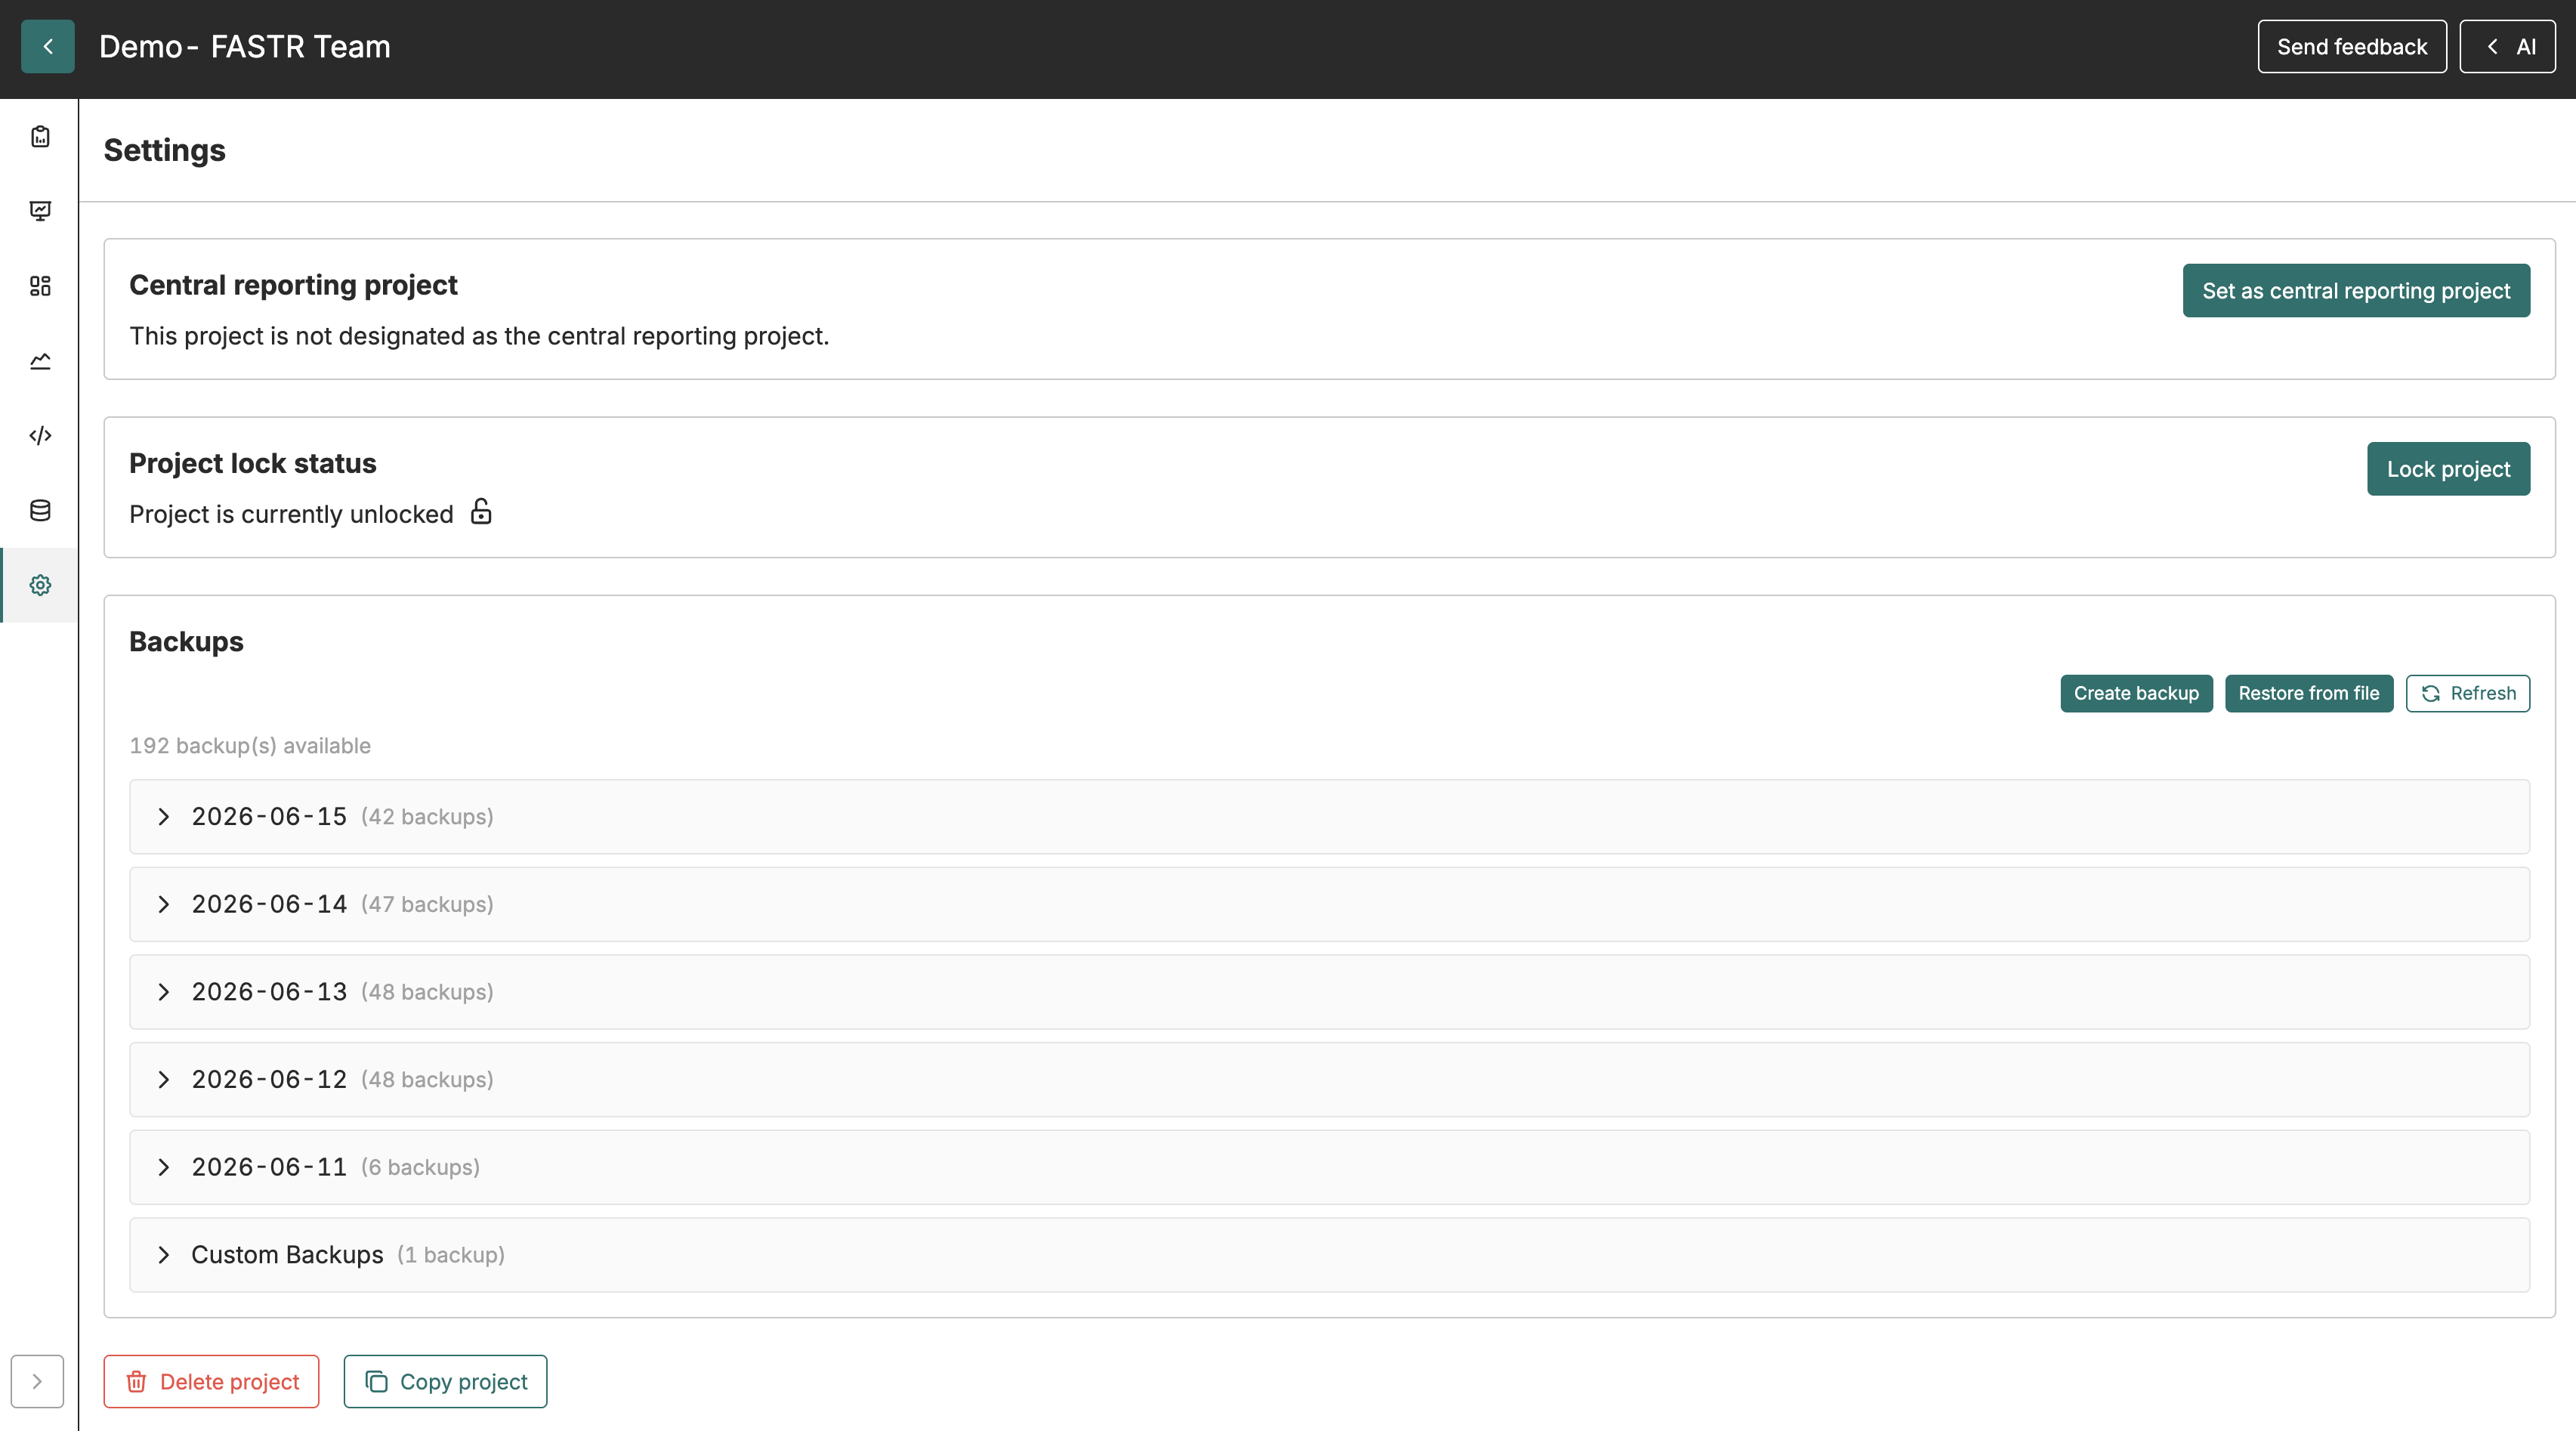
Section titled “Locking projects”When an analysis is complete, you can lock the project to preserve its state. A locked project prevents changes to modules, data configuration, and visualizations while still allowing users to view reports and export outputs.
In project Settings, find the Project lock status section and click Lock project. The project card on the home screen will display a lock icon. To resume editing, return to settings and click Unlock project.
Copying projects
Section titled “Copying projects”Sometimes you need a project similar to an existing one - perhaps the same modules but for a different time period. Rather than starting from scratch, copy the original.
Open the source project, go to Settings, and click Copy project. Enter a name for the new project. The copy runs in the background and may take several minutes for large projects. The new project appears on the home screen once complete, with all module installations, parameter settings, visualizations, and reports included.
Project AI context
Section titled “Project AI context”FASTR’s AI assistant can interpret charts and suggest insights, but its responses are more useful when it understands the project’s context. In Settings, you can set a Project context for AI interpretation - a description of what this project analyzes or the questions it aims to answer. Changes to the AI context take effect immediately across the project and are visible to all users working in it. A few sentences about the project’s purpose can significantly improve the quality of AI-assisted analysis.
Appearance
Section titled “Appearance”Each user can switch between light, dark, and system-default appearance from their profile. Open your profile by clicking your avatar in the top bar, then go to the Appearance section and choose Light, Dark, or System to follow your operating system’s preference. The setting is saved per browser and takes effect immediately — all charts, maps, and tables adapt to the selected theme.