
Modules
Modules are the analytical engines that transform raw health data into meaningful outputs. They run R scripts behind the scenes to calculate coverage rates, quality scores, trend analyses, and other metrics. As a user, you don’t need to write or understand code - you just need to know how to find and work with the results modules produce.
What modules produce
Section titled “What modules produce”Each module processes your project’s data and generates results objects - structured datasets containing calculated values. A data quality module might produce completeness scores for each facility and month. A coverage module might calculate immunization rates by district and quarter. These results become the raw material for visualizations.
Results objects contain metrics - the specific values you can visualize. A single module might produce dozens of metrics across several results objects. For example, a data quality module could generate reporting rate, outlier score, and internal consistency metrics all at once. When you create a visualization, you select one of these metrics as your starting point.
Module status
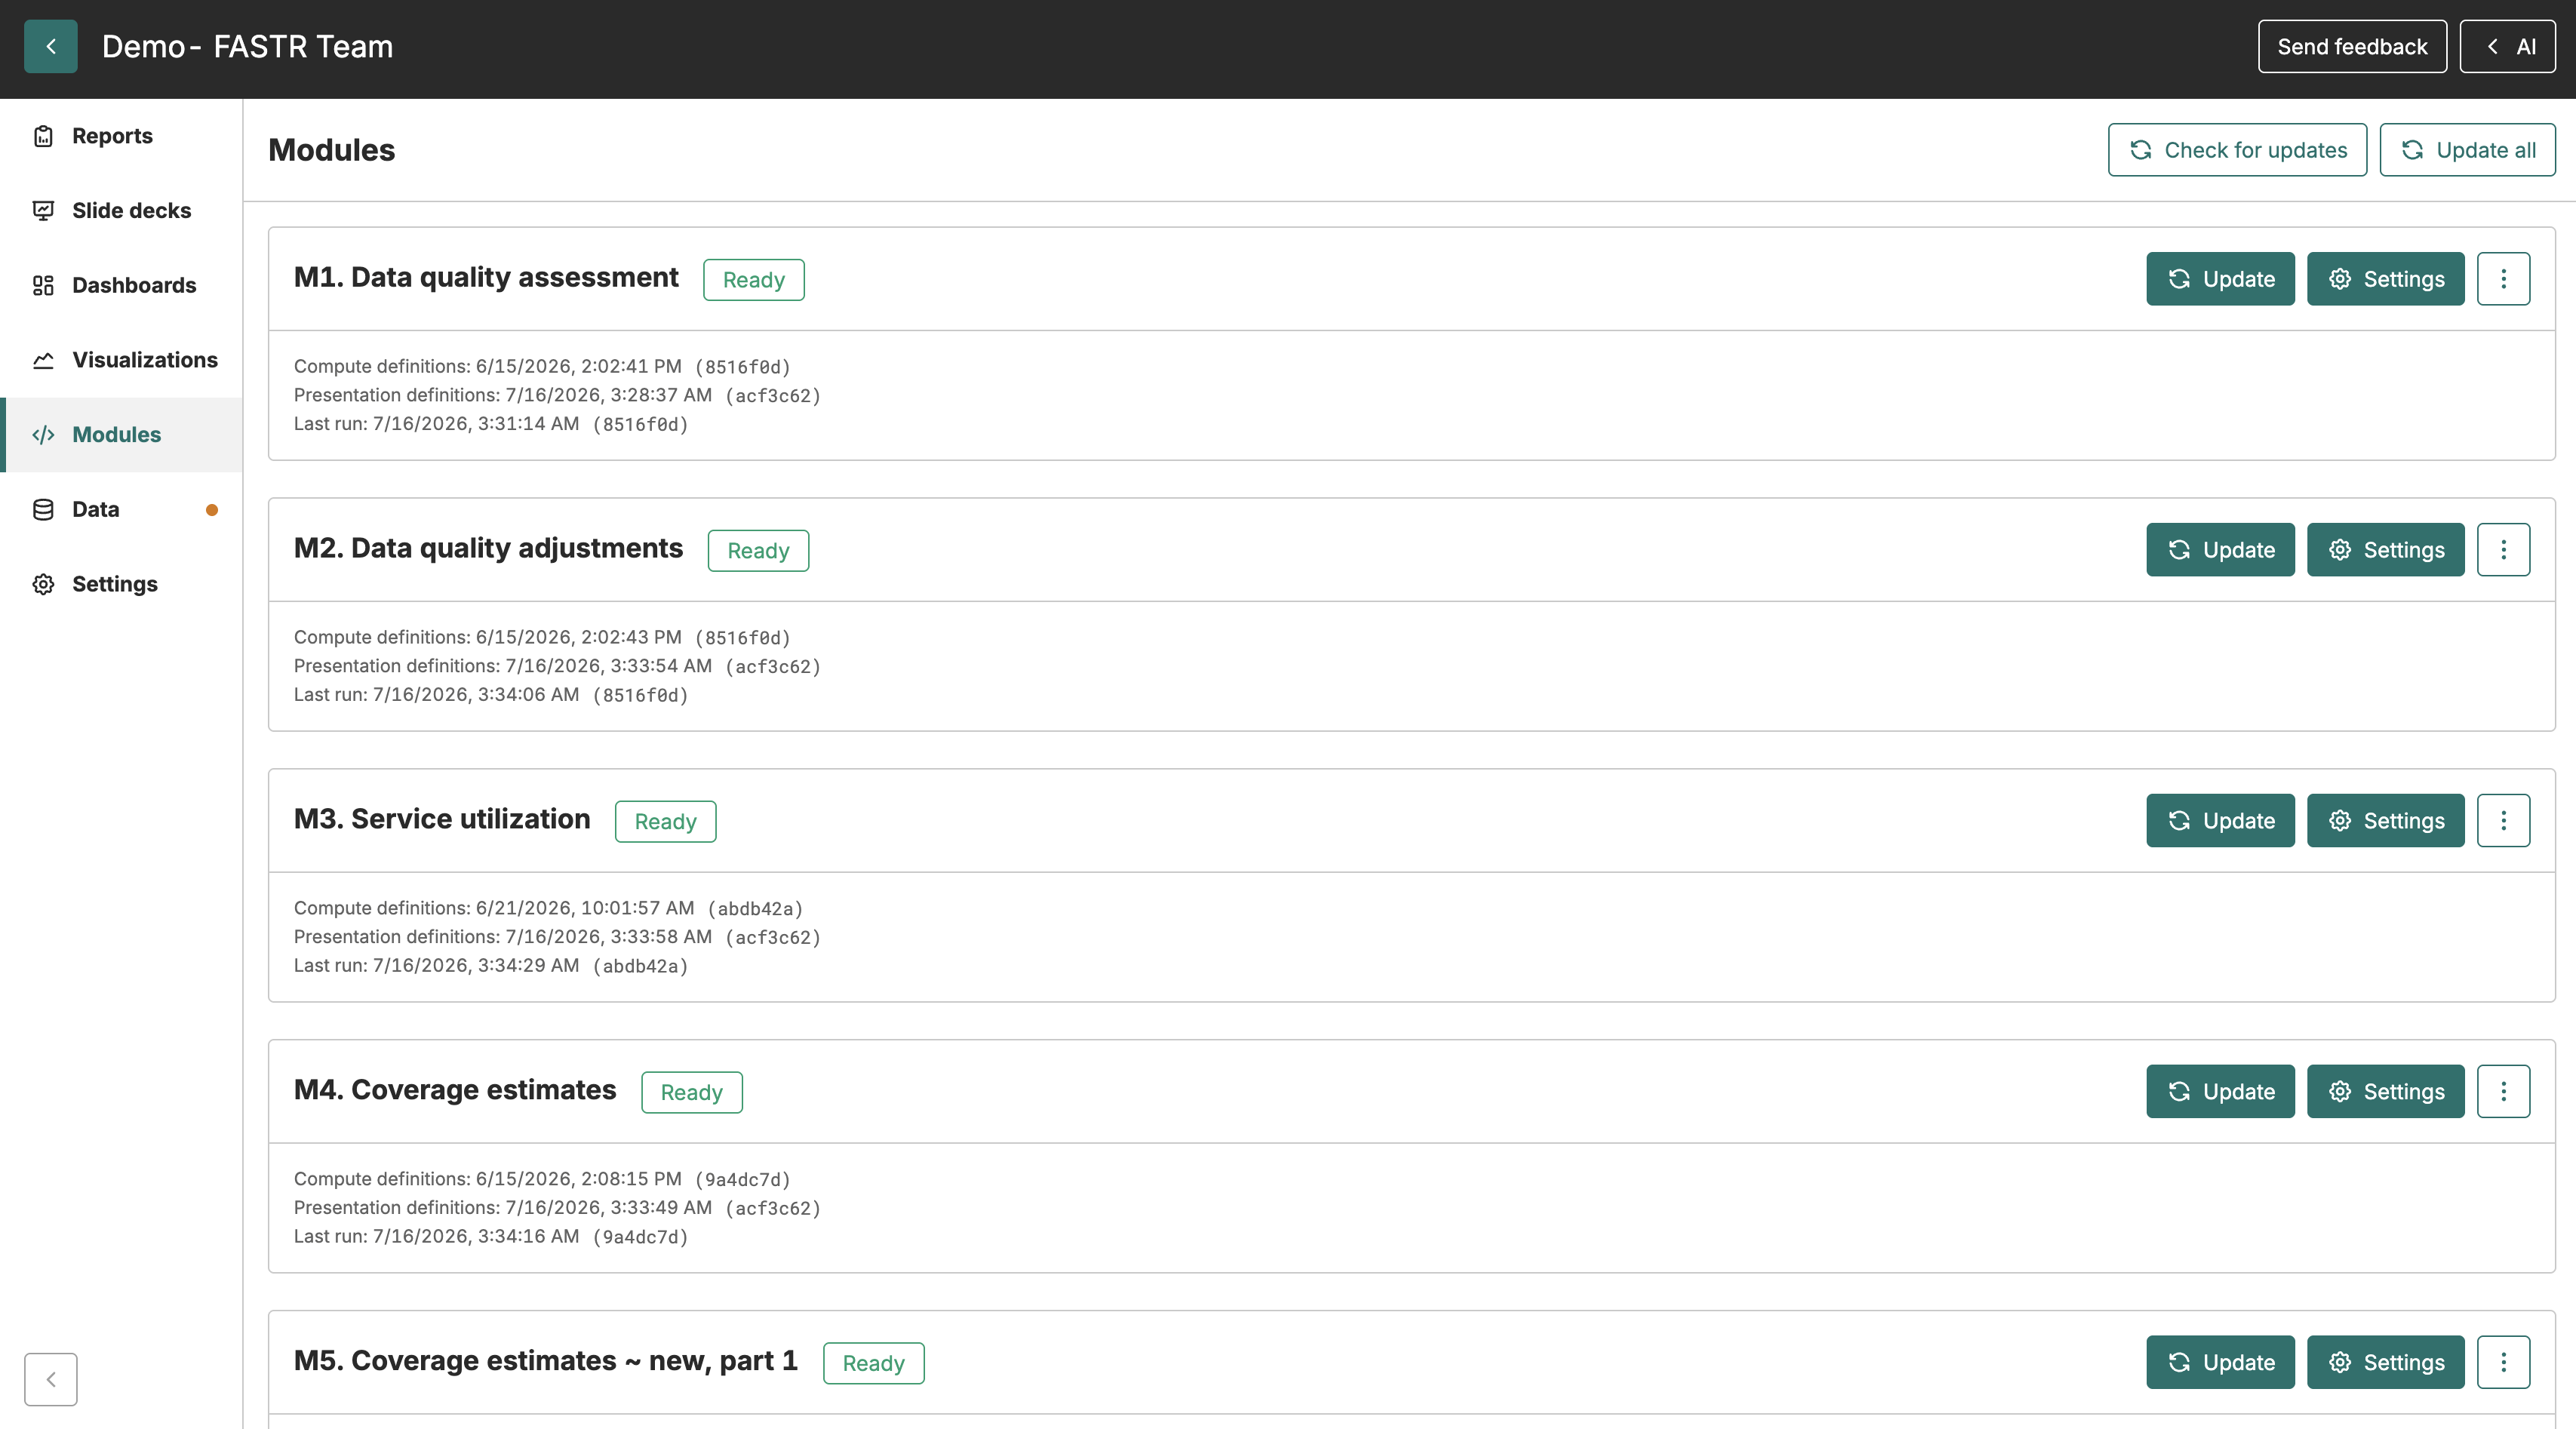
Section titled “Module status”The Results package tab shows the package your project is served from, including which modules it contains and their generation status:
- Ready - Results are available; you can create visualizations immediately
- Unavailable - The module’s results are not available in this package; contact your administrator for details
- Error - Something went wrong during generation; contact your administrator for details
When results update
Section titled “When results update”Module results are fixed within a results package. Results update when your administrator generates a new package with fresh data and attaches it to the project. If your project follows the instance’s pinned package, it switches automatically when an administrator pins a new one. You’ll see the results package change on the Results package tab when this happens.
Viewing module outputs
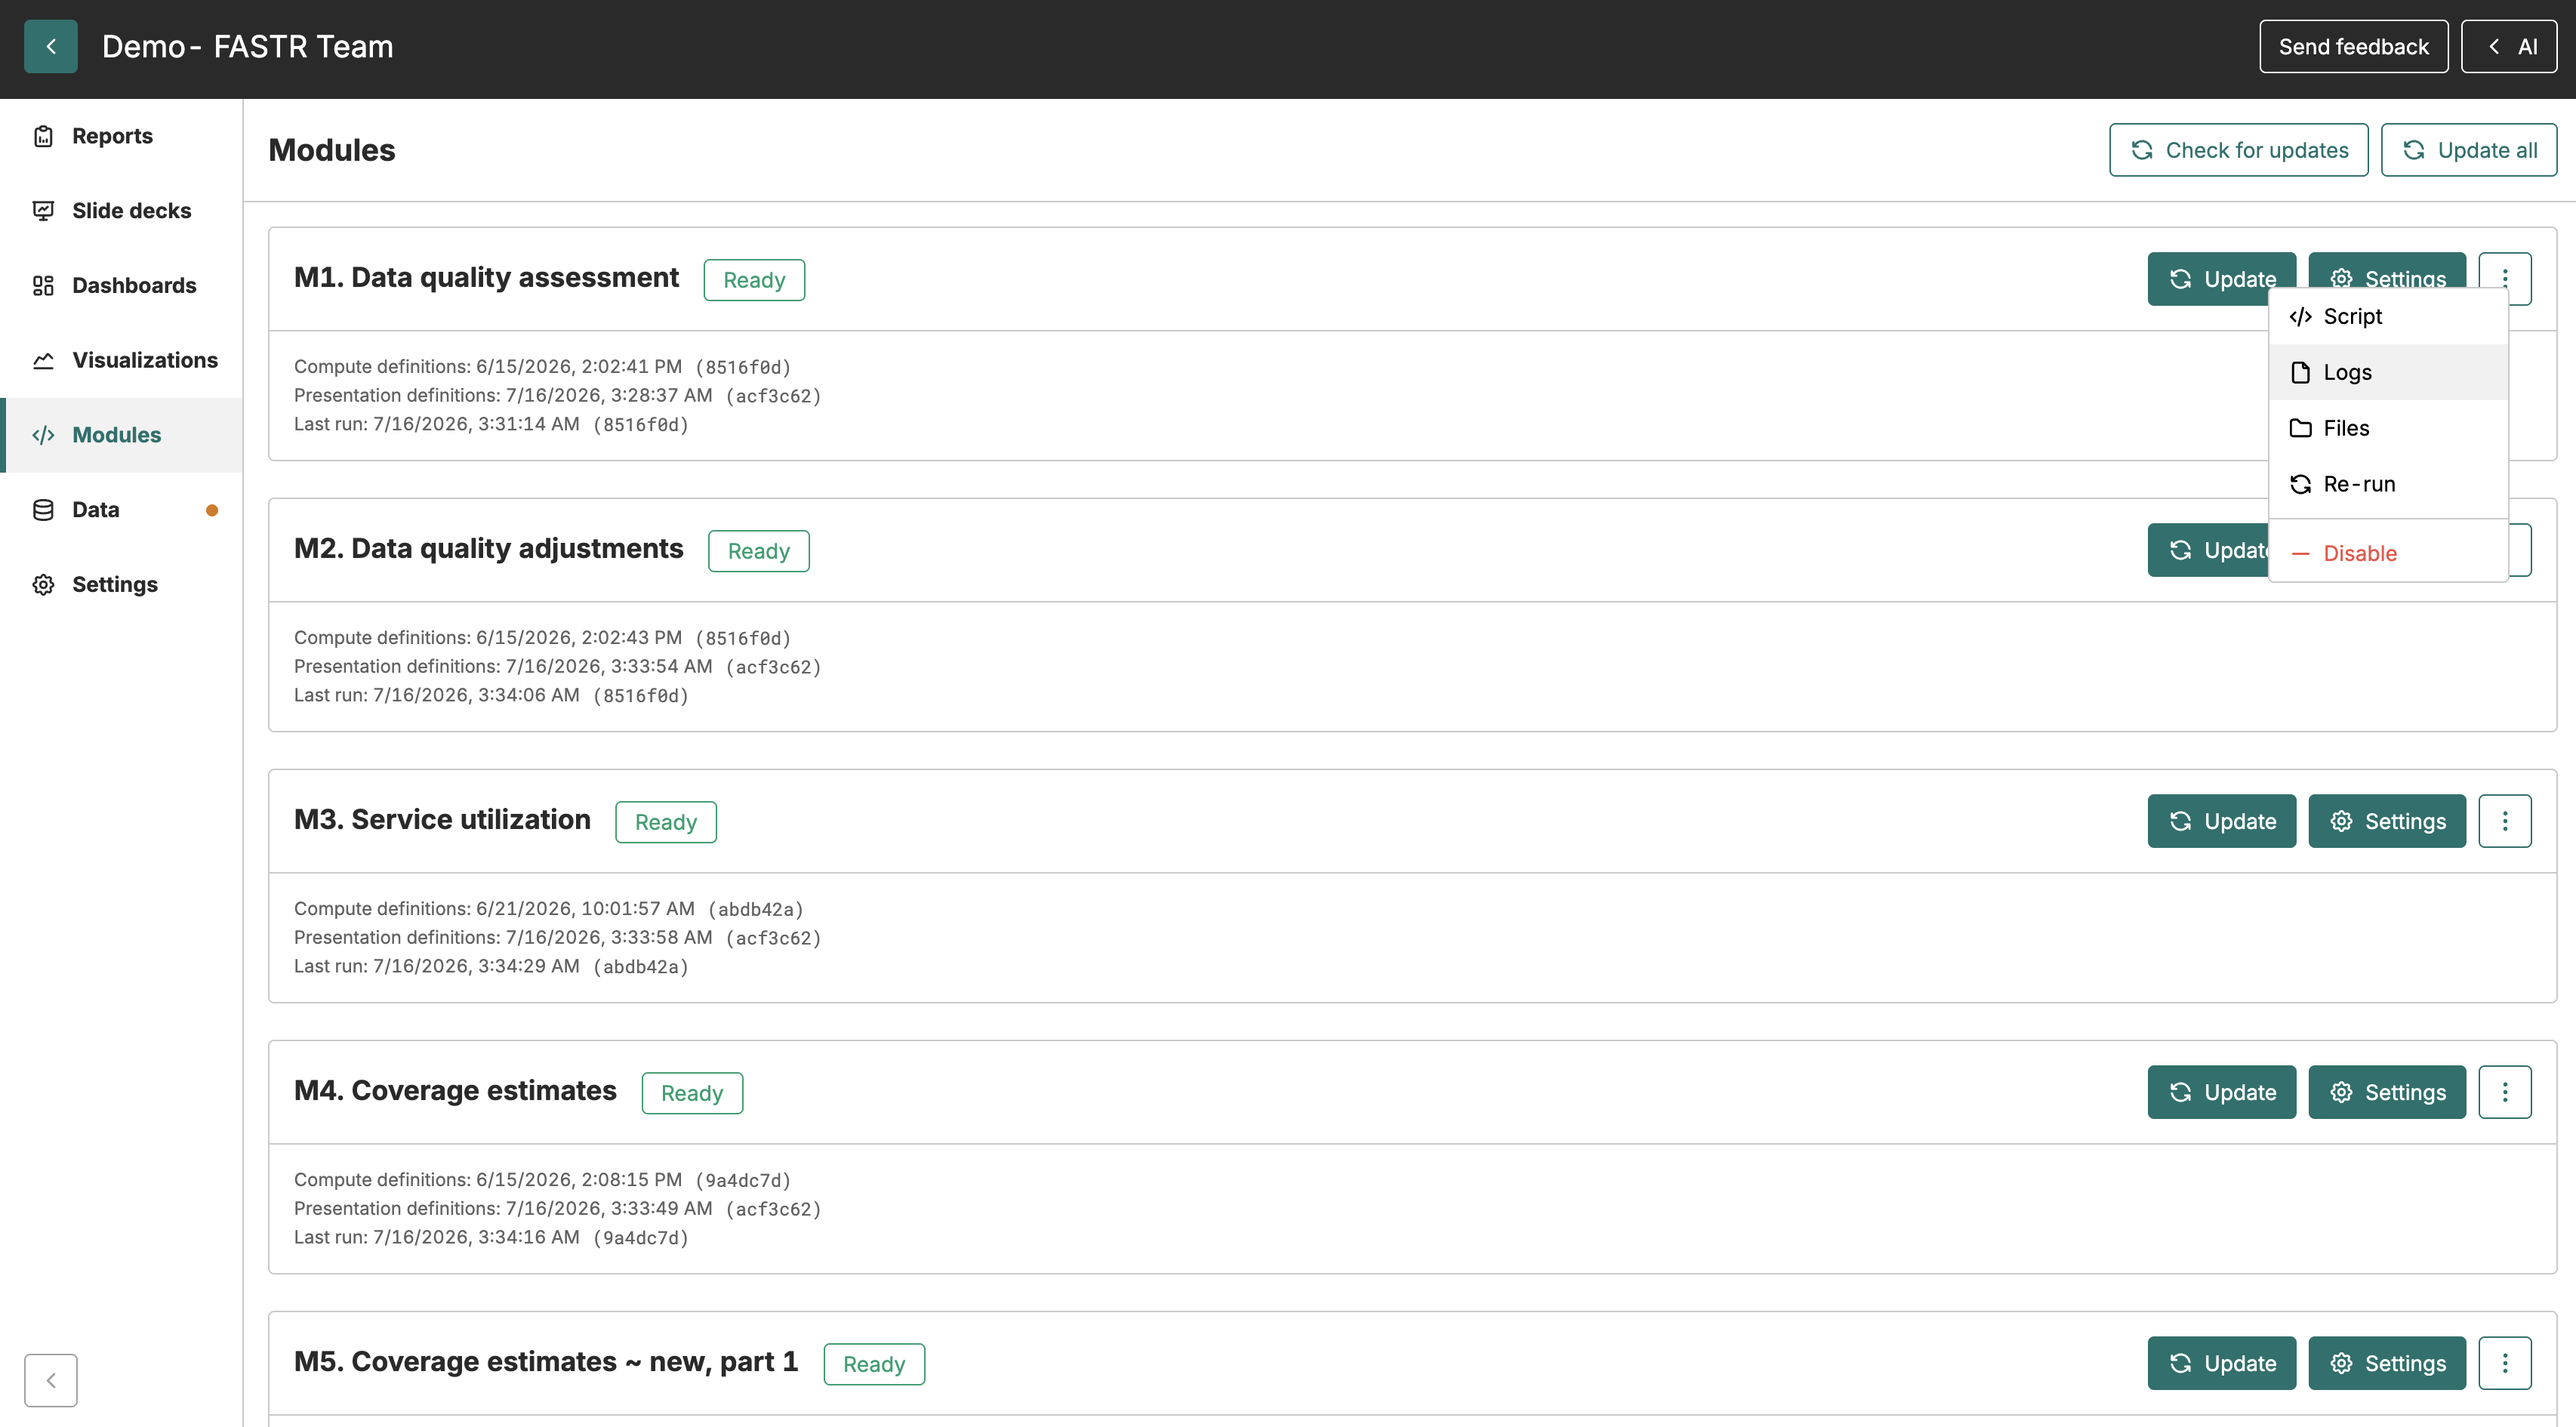
Section titled “Viewing module outputs”While you typically interact with module results through visualizations, you can inspect raw outputs from the Results package tab if you have the appropriate permissions. Access Logs (R console output, requires the View logs permission), Files (downloadable CSV results, requires View data), or Script (the R code itself, requires View data) from the package detail view.
Metrics and visualizations
Section titled “Metrics and visualizations”The connection between modules and visualizations runs through metrics. When you create a visualization, you first select a metric from a module’s results. The visualization then queries that metric according to your configuration choices.
Understanding this chain helps troubleshoot issues. If a visualization shows “no data,” check whether the results package contains results for that metric. If results look stale, check whether the project has been updated to use a newer package. If you’re missing a metric you expected, verify that the relevant module was included when the package was generated.
Some metrics come with presets - preconfigured visualization templates created by the module authors. Presets represent common ways to view that output and are a good starting point when you’re unfamiliar with a metric’s dimensions.
Module updates
Section titled “Module updates”Modules evolve over time as methodologies improve. Updated module outputs become available when your administrator generates a new results package using the updated module definitions and attaches it to your project. If you believe updated module results matter for your work, contact your project administrator.