
Dashboards
A dashboard collects several visualizations onto a single page so people can see the whole picture at once. Where a visualization answers one question, a dashboard answers a set of related ones - coverage, quality, and trends side by side. Dashboards stay live, so the charts update as your data does, and you can publish one as a web page that stakeholders open without a FASTR account.
Creating a dashboard
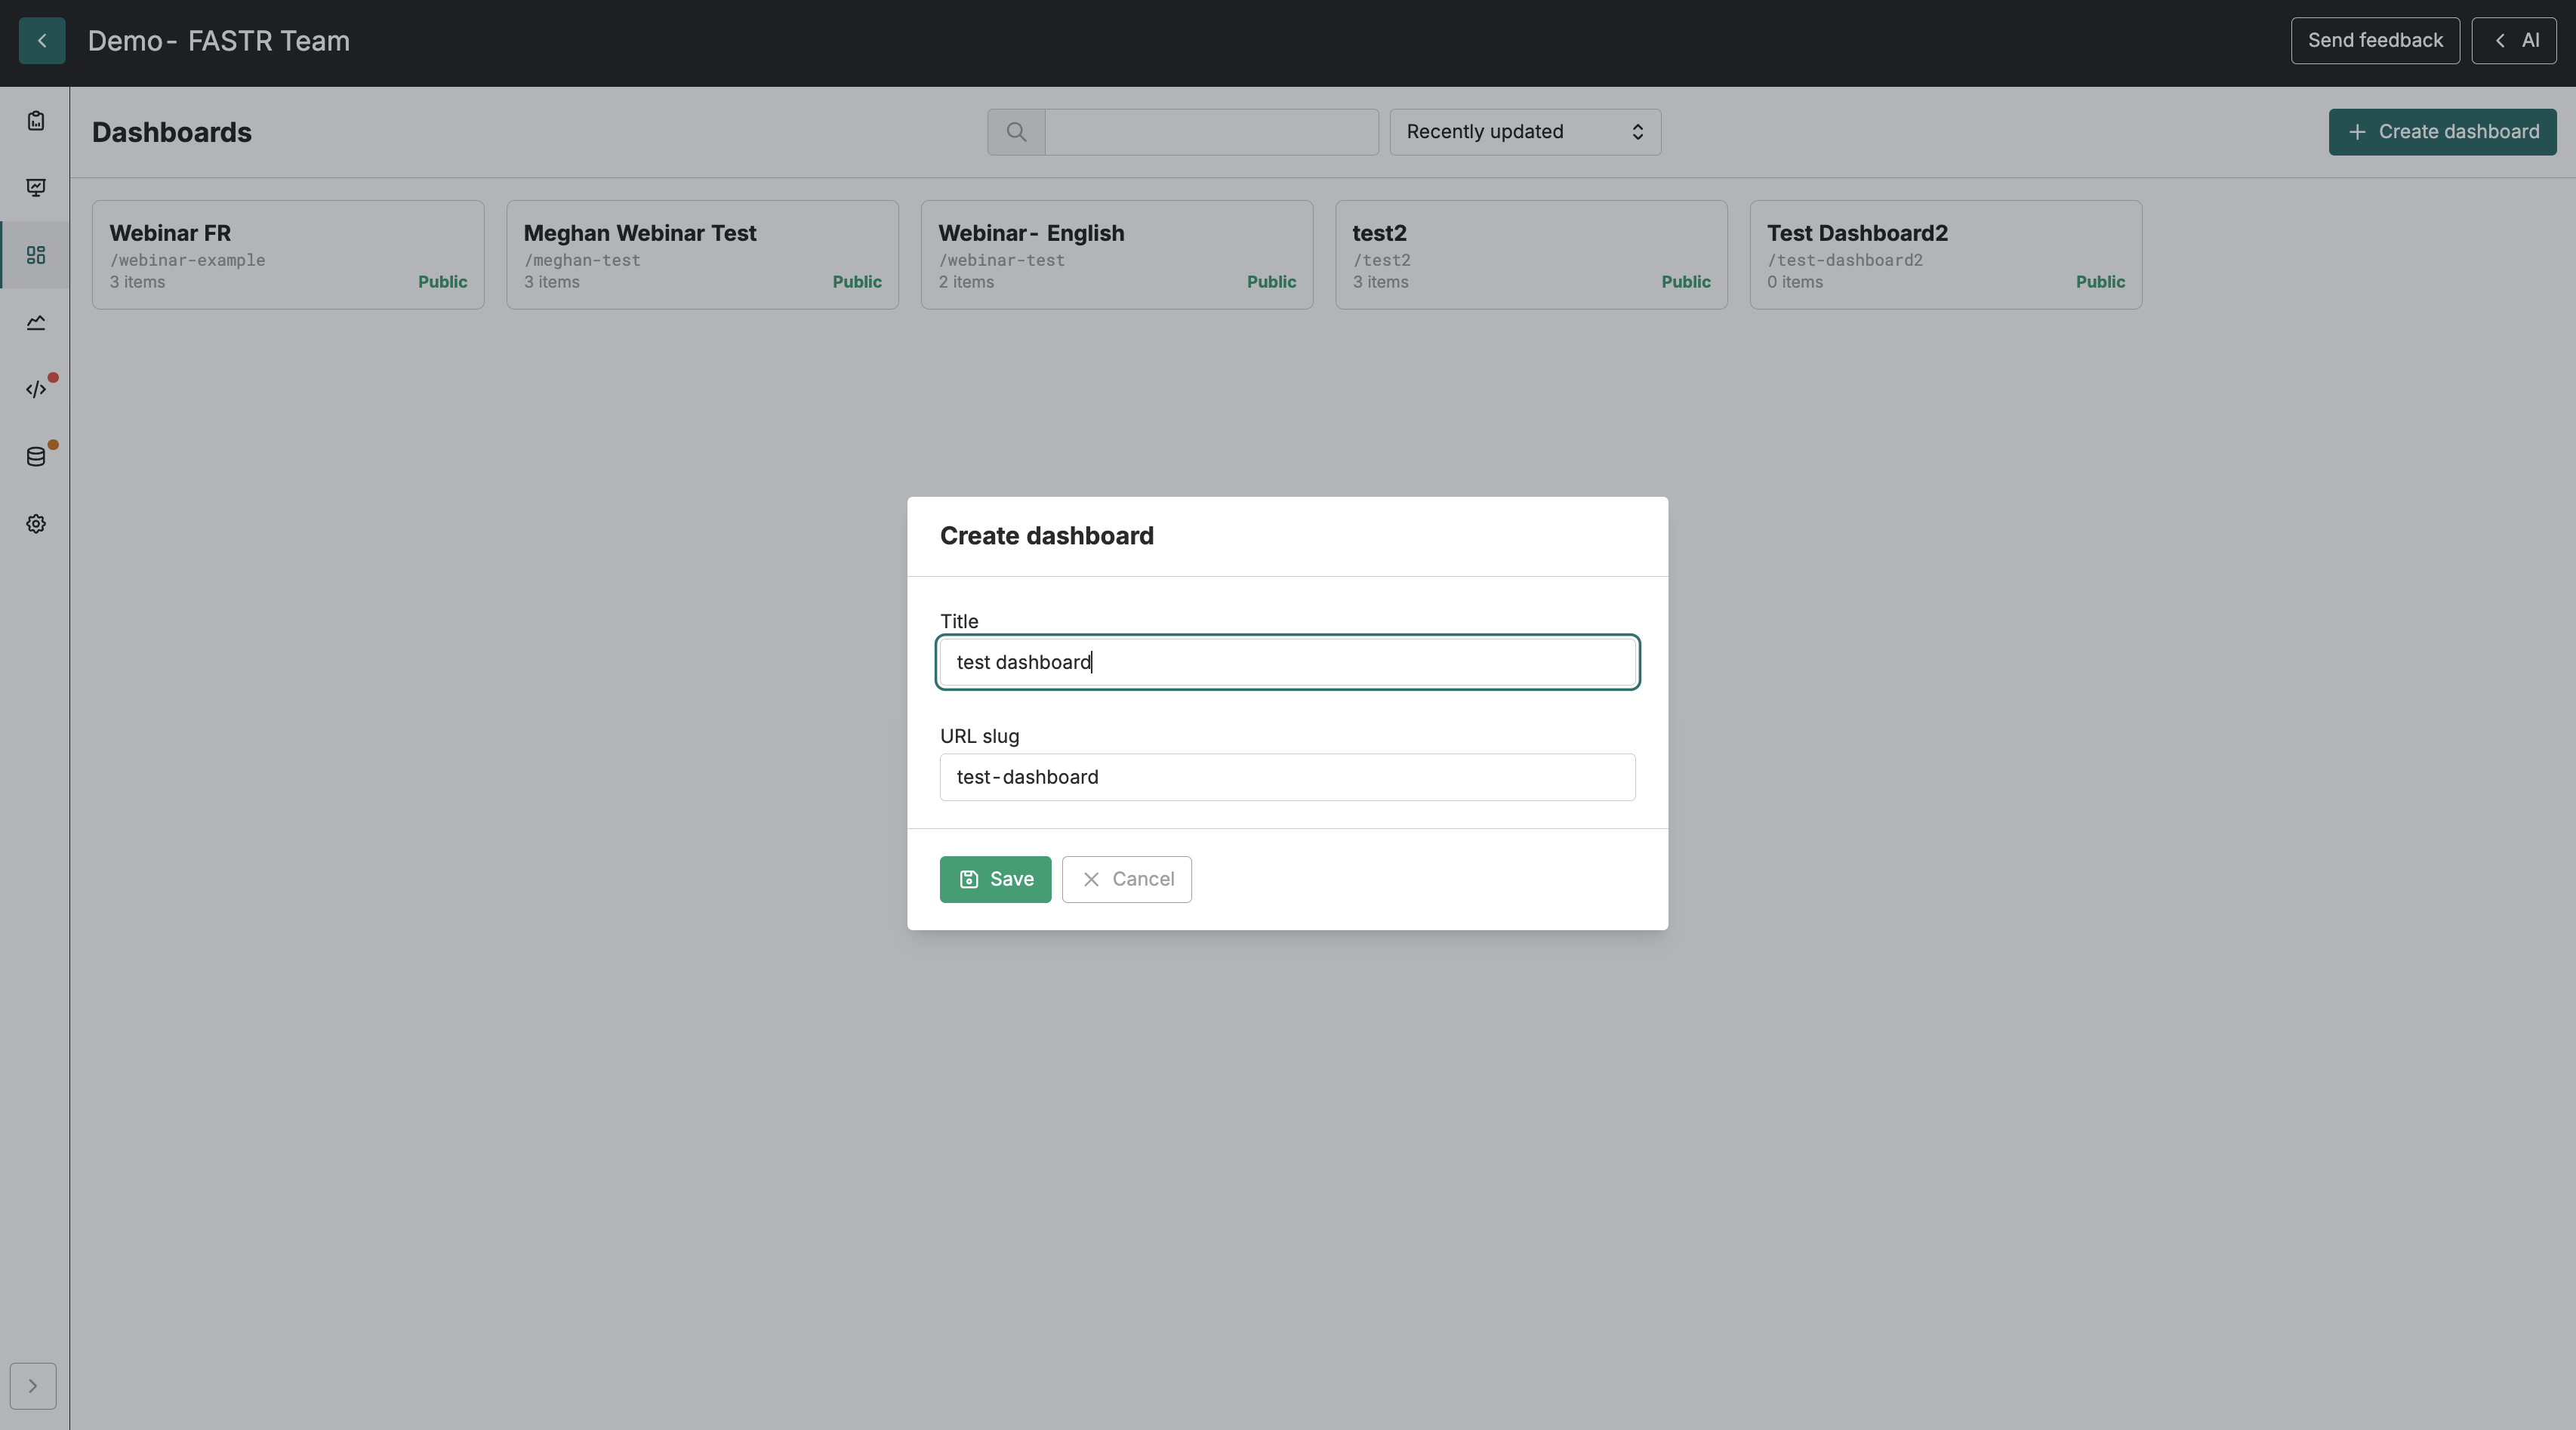
Section titled “Creating a dashboard”Open your project and go to the Dashboards section. Click Create dashboard and give it a Title. You can also set an optional URL slug - a short, readable identifier (lowercase letters, numbers, and hyphens) that becomes part of the public web address. If you leave it blank, FASTR generates one from the title.
The dashboard opens empty. You build it up by adding items, arranging them, and then deciding whether to keep it private or publish it.
Adding items
Section titled “Adding items”Each item on a dashboard is a card showing one of your saved visualizations. Click Add item and choose a visualization from the project. The card renders the chart, map, or table with its current settings, and it refreshes automatically whenever the underlying data changes.
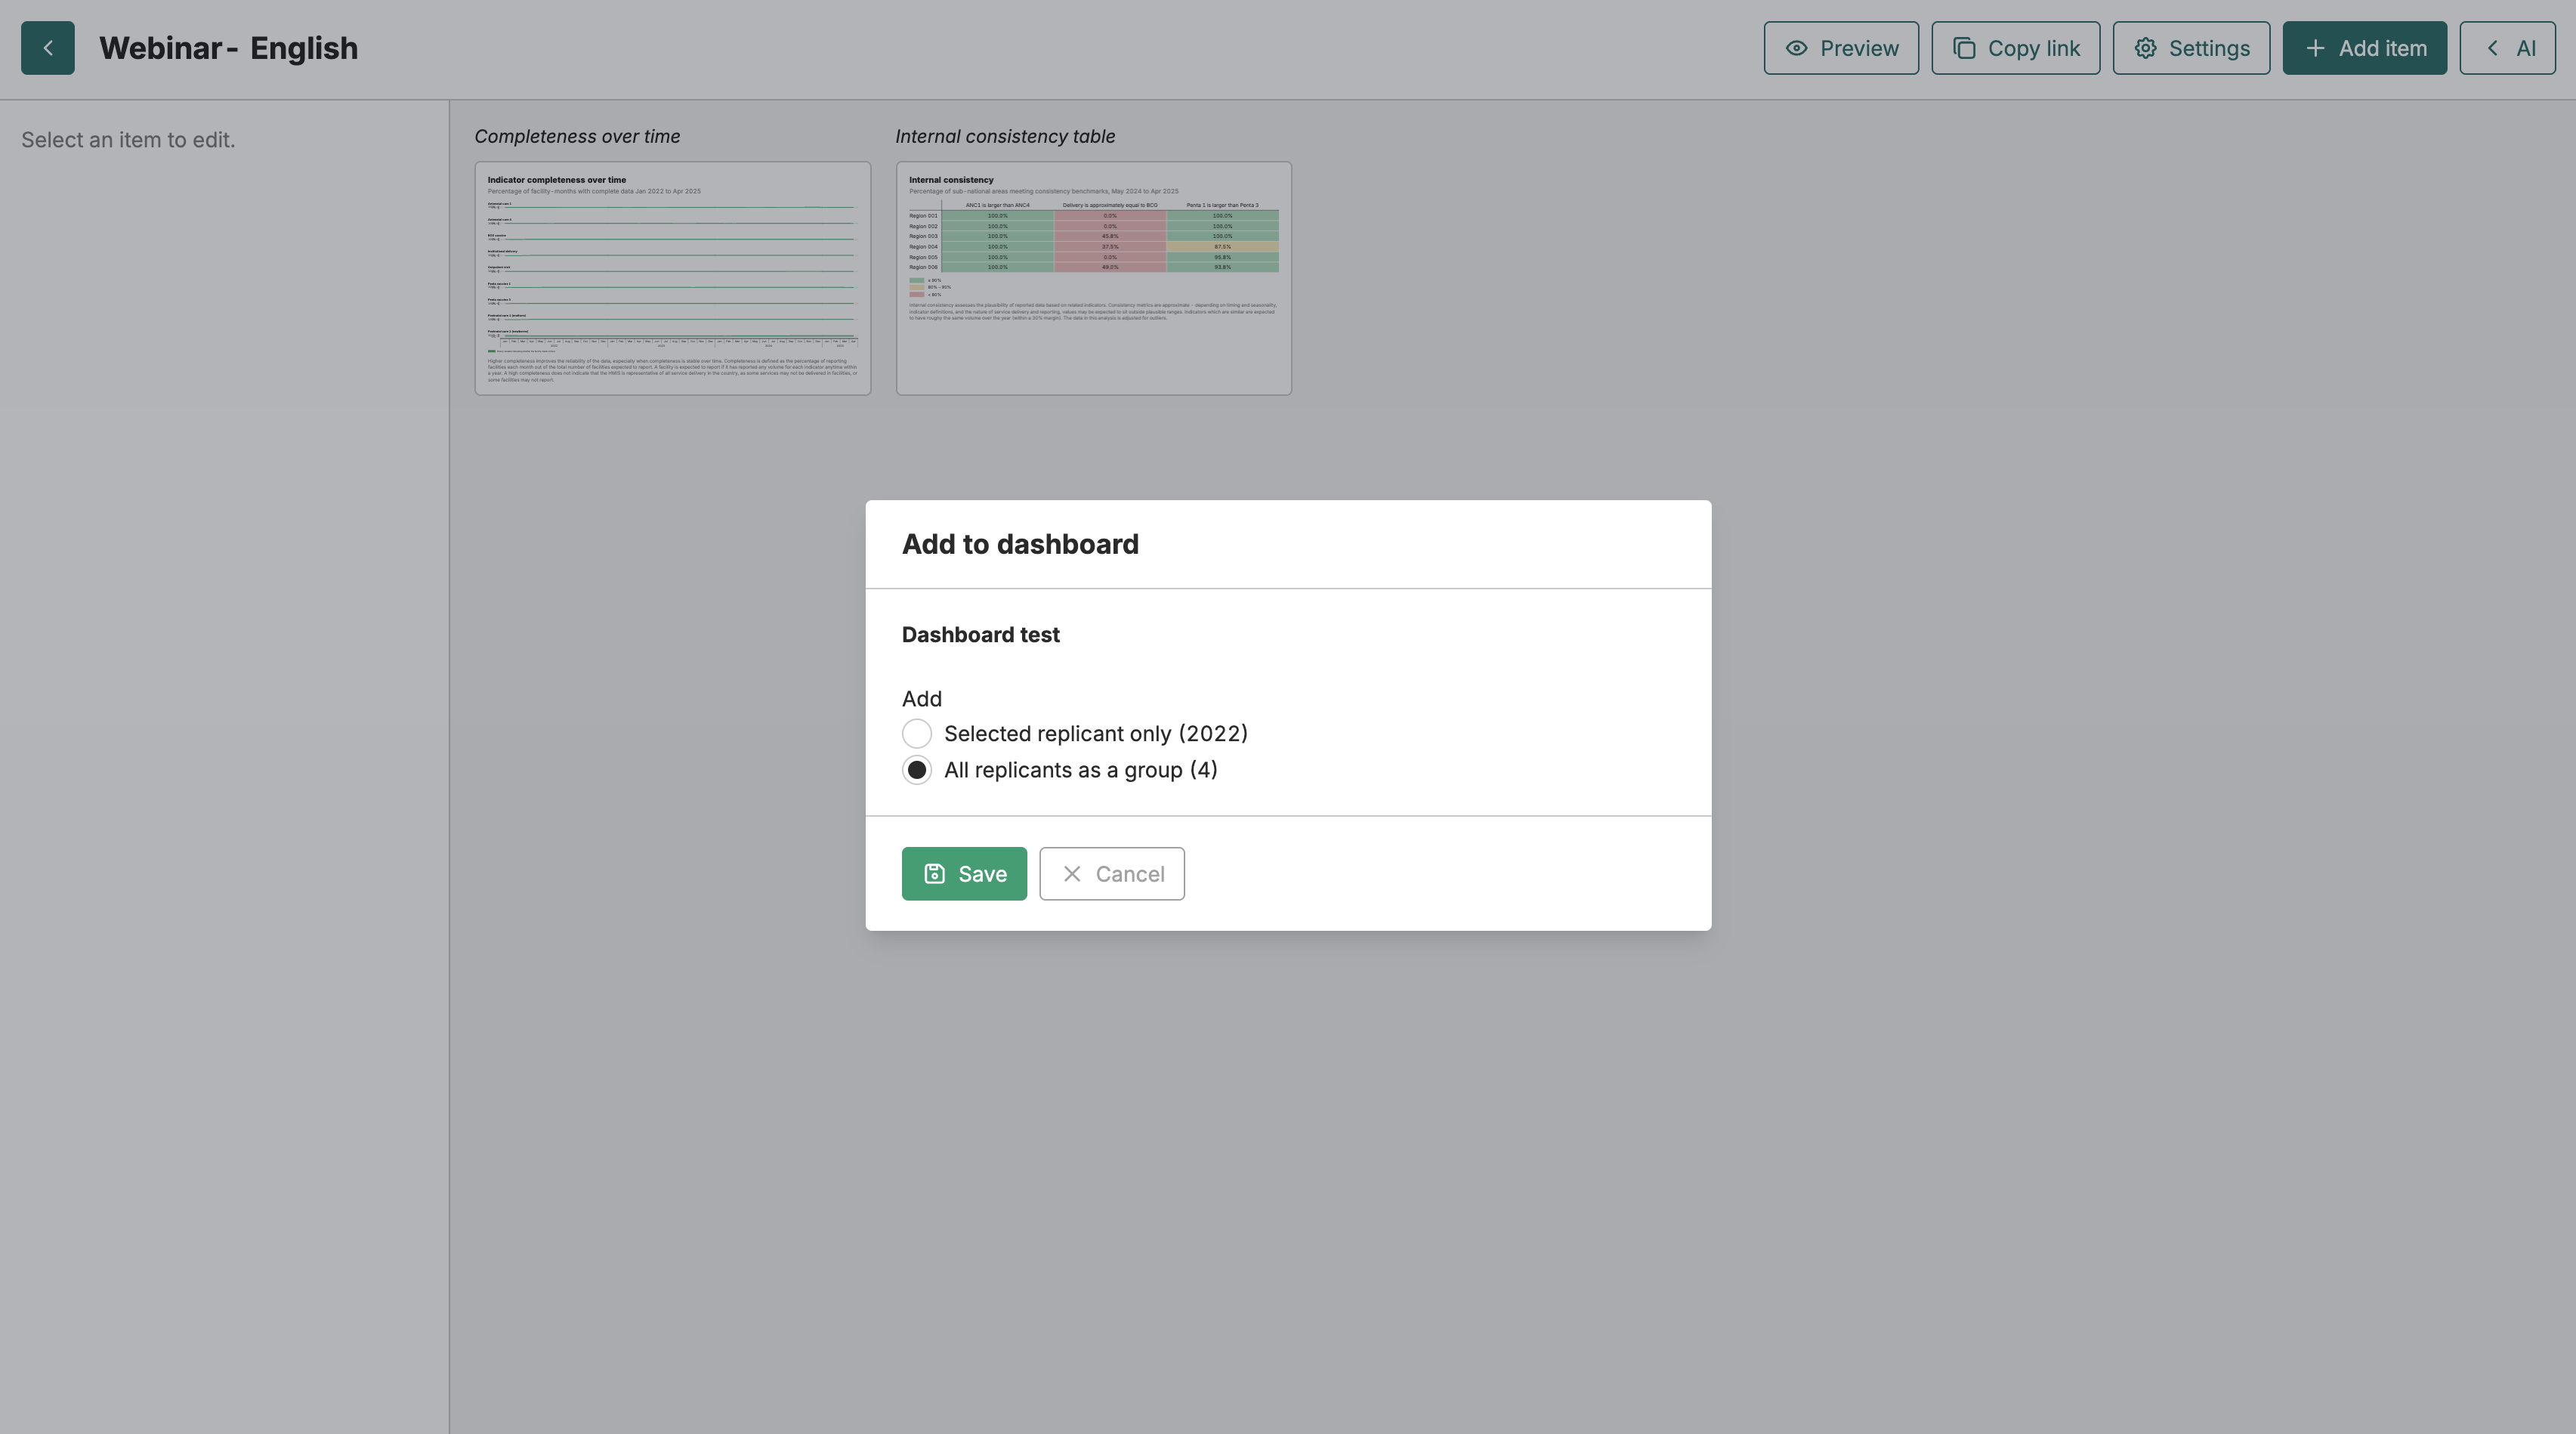
If the visualization you pick is split into replicants - separate variants of the same chart, one per region or facility, for example - FASTR asks how you want to add it. You can add just the selected replicant as a single card, or add all replicants as a group so every variant travels together as one unit.
Replicant groups
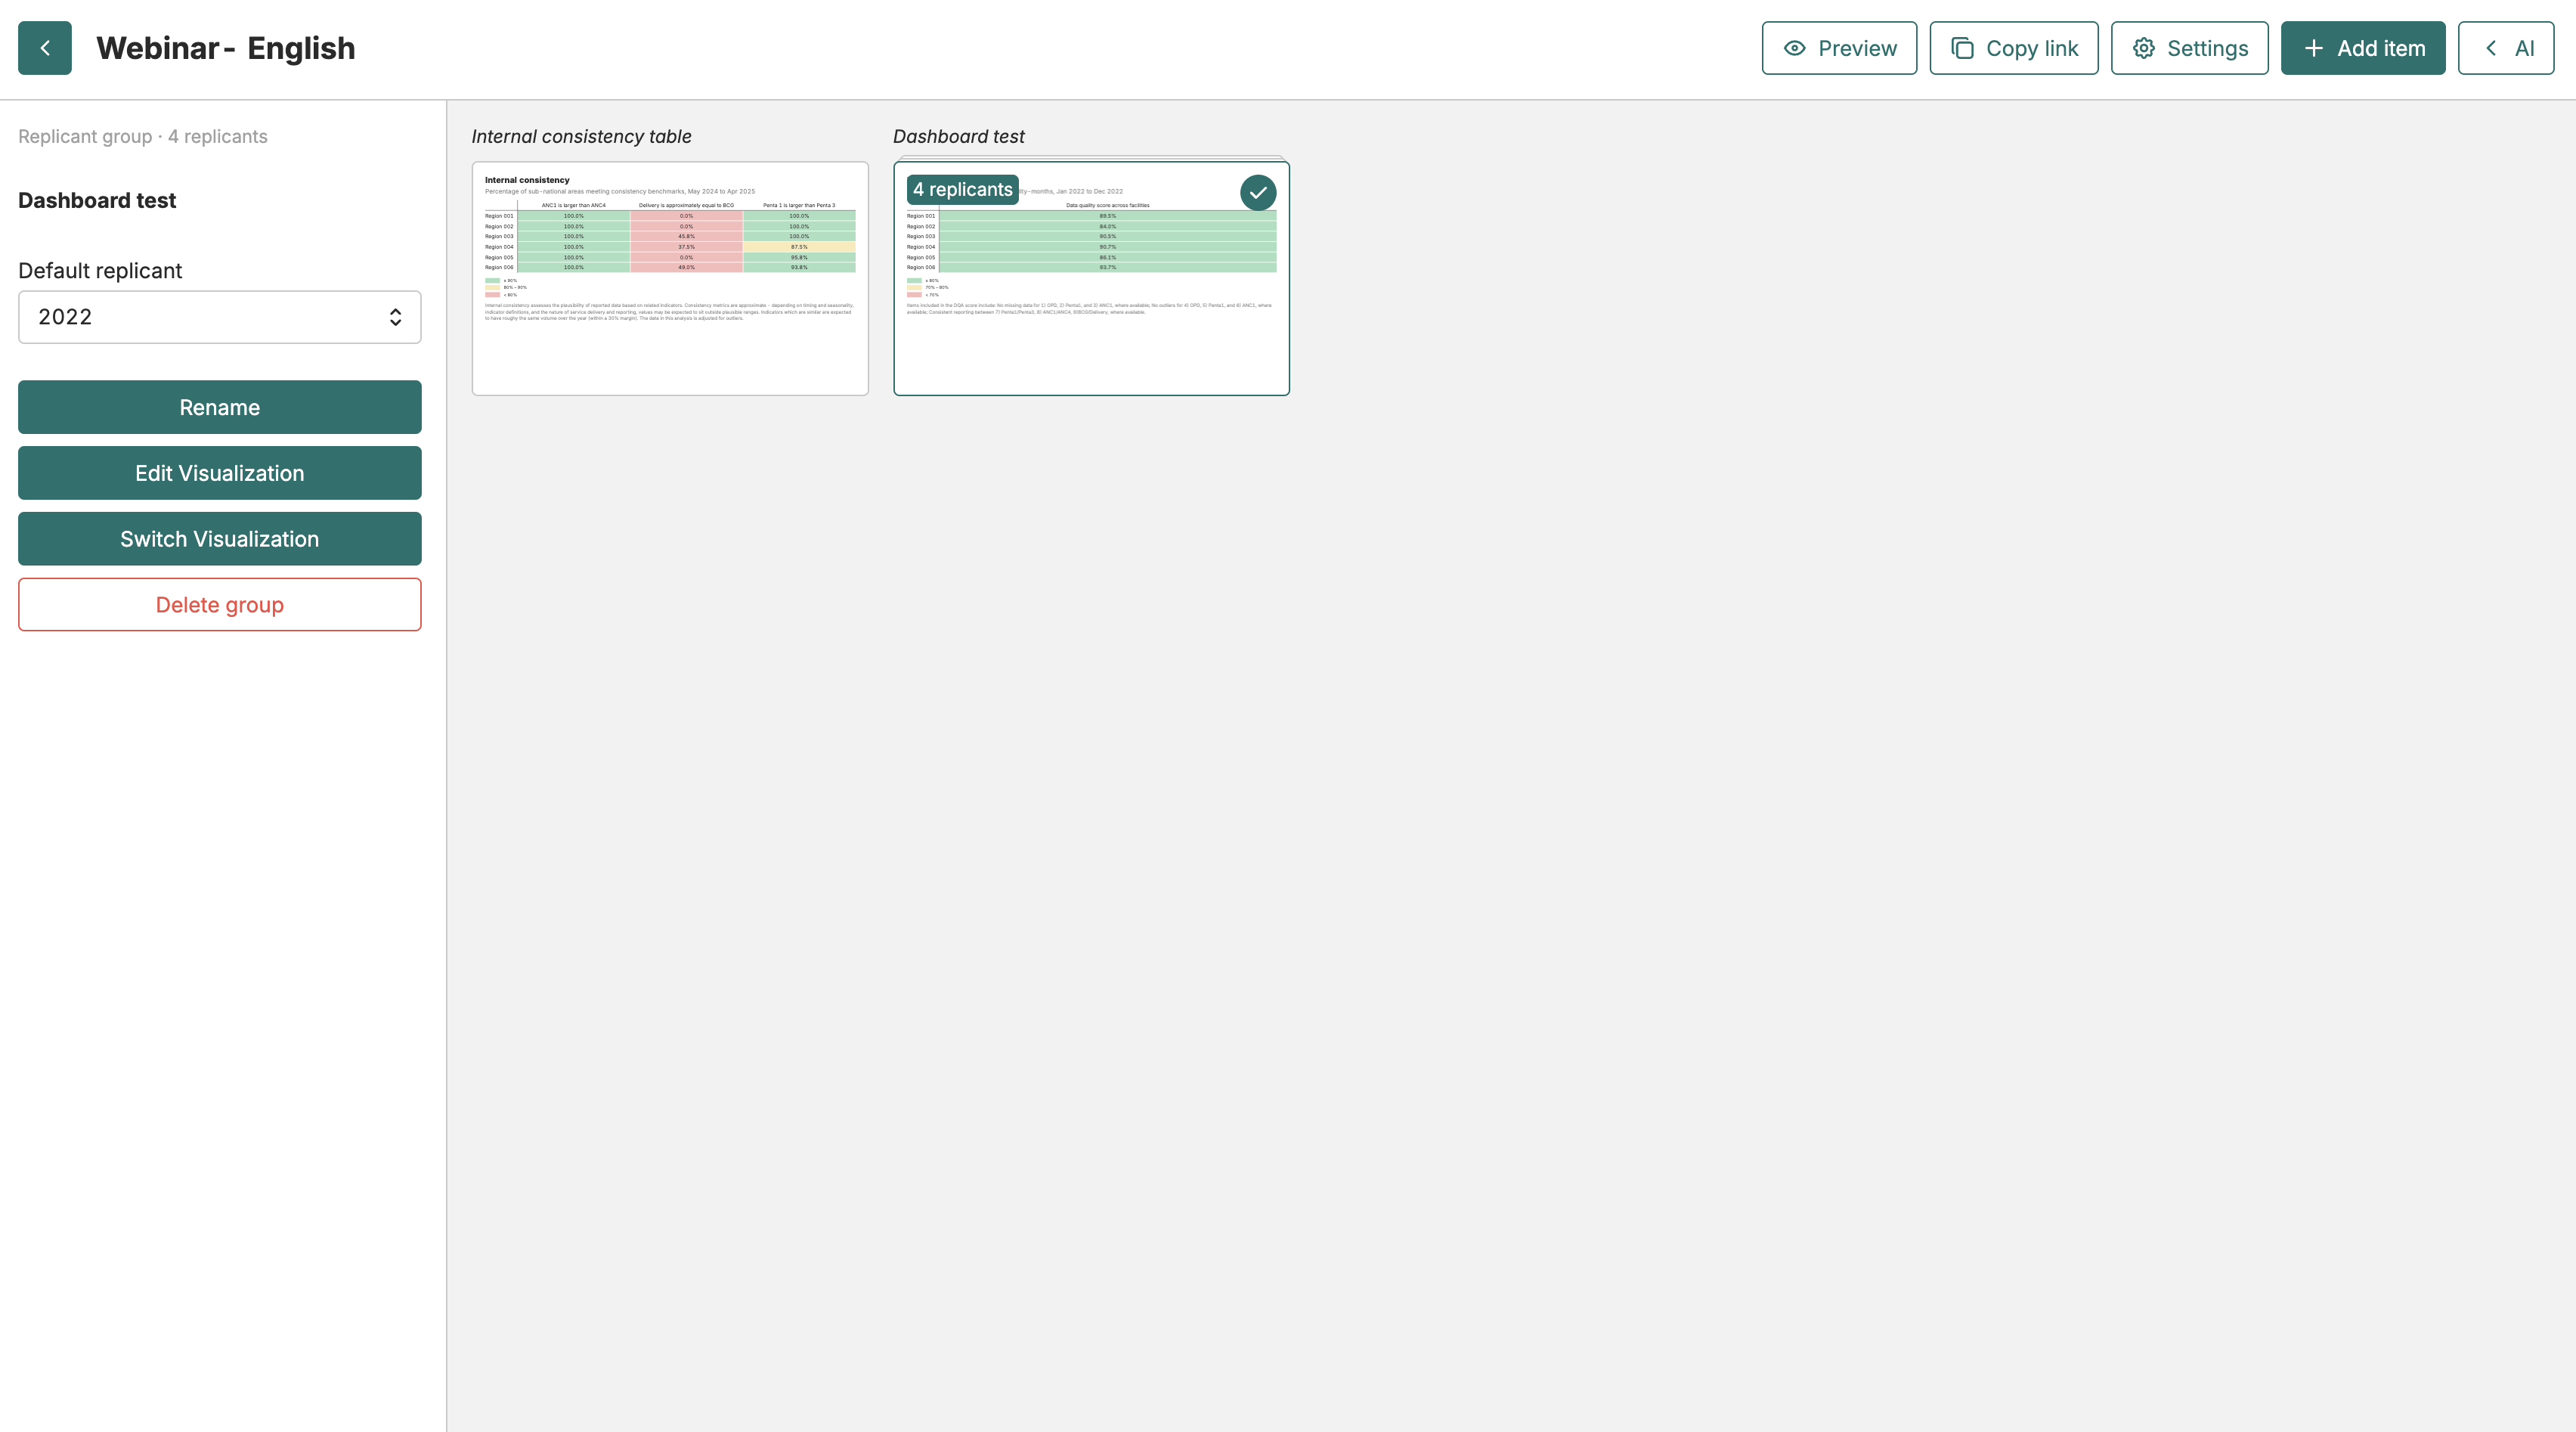
Section titled “Replicant groups”A replicant group is one card that holds many variants of the same visualization. Instead of cluttering the dashboard with a separate card for every district, you add one group and let viewers switch between members. On the dashboard, the group appears as a stacked card labelled with its member count - “12 replicants”, say - and shows one variant by default.
Select the group to open its editor on the left, where you can adjust how it behaves:
- Group label shows the current label; click Rename to change it
- Default replicant chooses which variant shows first before anyone interacts
- Edit visualization changes the configuration for every member at once
- Switch visualization swaps the whole group for a different visualization
- Delete group removes the group and all its members together
On a published dashboard, viewers get a dropdown on the group card to switch between members themselves - handy for letting a regional officer jump straight to their own area.
Renaming items and groups
Section titled “Renaming items and groups”To rename a dashboard item or group, select it in the editor and click Rename. A modal opens where you type the new label and confirm. The label updates immediately across the dashboard.
Arranging the layout
Section titled “Arranging the layout”Drag cards to reorder them; the grid reflows as you move things. To remove several cards at once, select them - click, then shift-click or cmd-click for multiple - and use the right-click menu to delete the selection. Spend a little time on order and grouping: a dashboard reads best when related charts sit near each other and the most important numbers come first.
Publishing and sharing
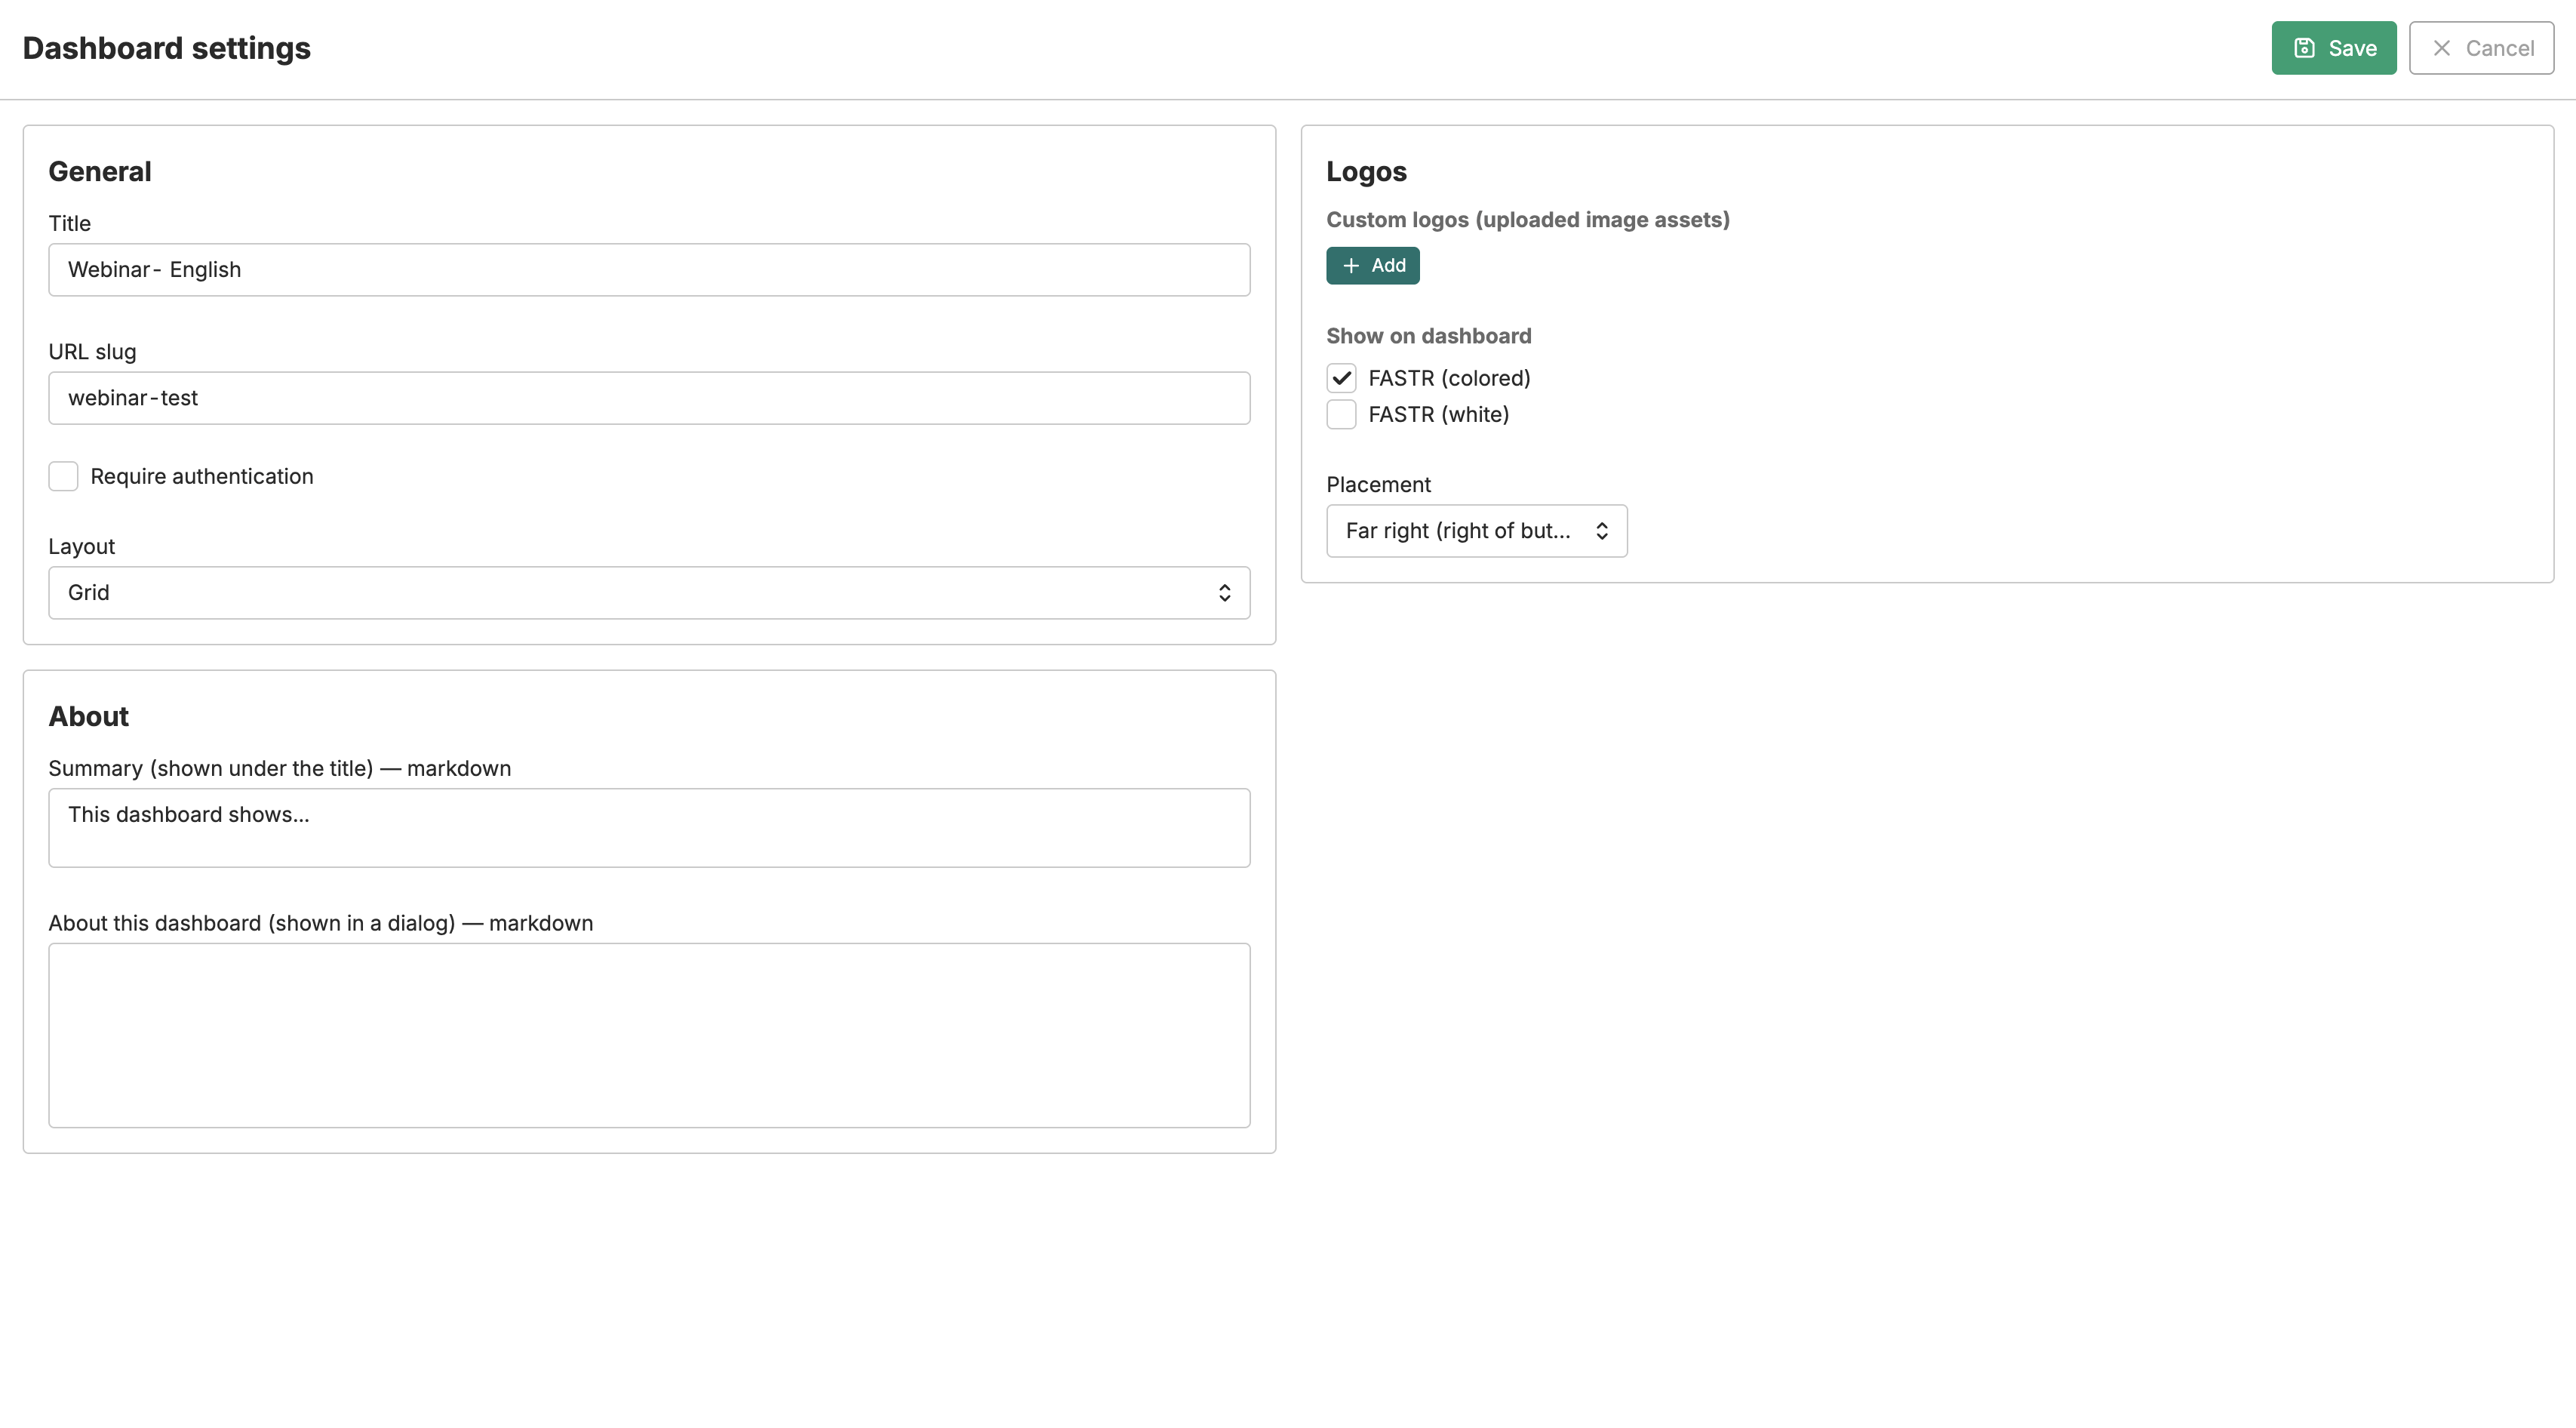
Section titled “Publishing and sharing”A dashboard can be private (FASTR login required) or public (anyone with the link can view). Open Settings to control this with the Require authentication toggle. Leave it off to make the dashboard public.
The same panel offers two layouts for the published view. Grid arranges every card in a responsive grid, which suits an at-a-glance overview. Sidebar lists items in a left-hand navigation menu and shows one large at a time, which suits walking an audience through items in sequence; replicant groups appear there as expandable sections.
When you’re ready to share, use Copy link to grab the public URL, or Preview to open the published dashboard in a new tab and check it the way a viewer will see it.
Common issues
Section titled “Common issues”A card shows “no data”: The visualization behind it has no results for the current data window or filters. Open that visualization to check its configuration - see Visualizations.
Changes aren’t on the public page: Confirm you saved, then reopen the public link. Use Preview to see exactly what viewers see rather than the editor.
The public link asks for a login: Require authentication is still on. Turn it off in Settings to make the dashboard public.