
Indicators
Indicators are the health metrics your FASTR instance tracks - things like immunization coverage rates, facility reporting rates, or outpatient visit counts. Before you can analyze data, you need to define which indicators matter and how they map to raw data. This page covers indicator configuration for both HMIS and HFA data sources.
HMIS indicators
Section titled “HMIS indicators”The HMIS indicator dictionary is a single flat list. Every indicator has a type that says what fills it: DHIS2 element (a monthly count the import fetches by its DHIS2 id), Uploaded (a monthly count filled by CSV import), Sum (the total of DHIS2 element or Uploaded indicators, added per facility and month), or Calculated (a formula over other indicators and population terms). The three count types are adjusted by the data quality modules; a calculated indicator is computed from the formula afterwards.
The indicator list
Section titled “The indicator list”The list shows every indicator with its id, label, type, and definition. The Type column displays a badge for each indicator type: DHIS2 element is a count fetched from DHIS2. Uploaded is a count filled by CSV import. Sum is the total of other counts. Calculated is a formula. The Defined by column shows the DHIS2 id of a DHIS2 element indicator, the members of a Sum, or the formula of a Calculated indicator. Long indicator IDs and labels wrap at underscores so they remain readable without horizontal scrolling. The indicator count is shown in the list heading.
Adding indicators from DHIS2
Section titled “Adding indicators from DHIS2”Click Add from DHIS2 in the indicator manager toolbar to add data elements from your DHIS2 server to the list as DHIS2 elements. FASTR uses the instance’s stored DHIS2 connection, which is set in the DHIS2 connection card on the Data page. If no stored connection exists, set one up there first.
The form lets you search for data elements and DHIS2 indicators by name, code, or ID. Data elements are checked for eligibility: they must have SUM aggregation, a count-type value type, and be collected monthly. Ineligible items are shown with the reason they cannot be added. DHIS2 indicators (formulas) are decomposed into their operands, which become DHIS2 element indicators, and a Calculated indicator whose formula is over those operands.
After selecting items, a naming step lets you confirm or edit the indicator ID and label for each new indicator before saving. Proposed IDs are generated from the DHIS2 name and are editable. Items whose DHIS2 id is already carried by an existing indicator are shown as already imported and create nothing new.
When an indicator is created through the DHIS2 picker, FASTR reads the element or operand name from live DHIS2 metadata and stores it as the DHIS2 name. This stored name is shown in the editor alongside the DHIS2 id, so you can identify the element without looking it up in DHIS2. It is never edited after creation; if you change the DHIS2 id, the stored name is cleared.
Refreshing DHIS2 names
Section titled “Refreshing DHIS2 names”If element names change in DHIS2 over time, you can update the stored DHIS2 names without changing any labels, ids, or data. Click the overflow menu in the indicator manager toolbar and select Refresh DHIS2 names. FASTR reads the current name of every DHIS2 element indicator from DHIS2 by its DHIS2 id and stores it as the indicator’s DHIS2 name. Elements DHIS2 no longer has keep their stored name unchanged. A summary shows how many names were updated, how many were already current, and which DHIS2 ids were not found.
Creating and editing indicators
Section titled “Creating and editing indicators”Click Create new to open the indicator editor. The editor handles all four types in a single form. Choose the type first — the definition section changes to match. You can also open the editor from an existing row to update it.
Every indicator has an Indicator ID (used in formulas and imports), a Label (shown in visualizations), and an Include in analysis checkbox. When include in analysis is on, every results package analyses this indicator. When it is off, the indicator is dictionary-only: its data is still imported and stored, and it can still be a member of a sum or used in a formula.
Indicator IDs can be renamed. Renaming rewrites every formula and import schedule that names the indicator; its data stays where it is, and results packages already generated keep the old ID.
For a DHIS2 element indicator, the editor shows the stored DHIS2 name below the DHIS2 id field when one is available. This name is read-only and reflects what DHIS2 called the element when the picker created the indicator.
Special indicators
Section titled “Special indicators”Certain indicator IDs are read by name by the analysis modules and are always analysed. These special indicators must stay as a DHIS2 element, Uploaded, or Sum — they cannot be Calculated indicators. A Special badge appears beside these IDs in the manager and in the editor as you type. Click Special indicators and reserved words in the manager toolbar to see the full list of special IDs, population terms, and reserved words.
Indicator types in detail
Section titled “Indicator types in detail”Click Indicator types in the manager toolbar to open a reference panel that explains each type: where its data comes from, whether the data quality modules adjust it, whether it holds its own data rows, and what format it may have.
A DHIS2 element indicator holds its own rows stored under its DHIS2 id. The DHIS2 id is fixed once the indicator has data; rename the indicator to change its display name. A Sum adds its members’ counts per facility and month; members must be DHIS2 element or Uploaded indicators. An Uploaded indicator’s internal key is managed by FASTR and is never shown — you map values to it at the Mapping step of each CSV import.
Calculated indicators
Section titled “Calculated indicators”A Calculated indicator is defined by a formula over other indicators and population terms. It is computed after the data is aggregated, so a regional or annual figure is the formula applied to already-aggregated counts — not the average of per-facility results. Write the formula using +, -, *, /, and parentheses. Use other indicator IDs directly (for example anc4 / anc1), or reference a population term (for example anc4 / population_pregnancies). The functions abs(), coalesce(), and nullif() are available. Use the Insert indicator and Insert population palette controls in the editor to insert correctly written identifiers at the cursor position; a legend below the formula names every identifier the formula references and shows population data coverage.
A calculated indicator can be formatted as a number, a percent, or a rate per 10,000. You can also set a target value and a conditional formatting rule on a calculated indicator.
The editor validates formulas as you type. If a formula cannot be resolved — for example because it references an unknown identifier, creates a cycle, or has a syntax error — an error message appears below the formula field. If the formula is valid but references ingredients that have no data yet, a warning appears instead, letting you know the indicator cannot be computed until data is available. You can still save in this state; the warning does not block saving.
The indicator list includes a Status column for calculated indicators showing whether each can currently be computed. If one or more calculated indicators cannot be computed, a warning banner appears above the list.
You can also set a conditional formatting rule on any calculated indicator. When a visualization uses the Indicator CF source, each value is coloured by its own indicator’s rule.
Include in analysis
Section titled “Include in analysis”Every indicator has an Include in analysis checkbox. When it is on, every results package analyses the indicator: the data quality modules adjust it and it is available in visualizations. When it is off, the indicator is dictionary-only: its data is still imported and stored, and it is still usable as a member or in an expression.
Direction and target
Section titled “Direction and target”Every indicator has a Direction setting (higher is better or lower is better) that the conditional-formatting rule follows. A Calculated indicator also has an optional Target value shown in its display units.
Expected low counts
Section titled “Expected low counts”For DHIS2 element, Uploaded, and Sum indicators, you can enable Expected low counts. When on, the adjustment modules treat this indicator’s monthly facility counts as expected to be small.
Sorting indicators
Section titled “Sorting indicators”Indicators can be sorted using the Sort button. The saved order is what every indicator axis in every figure sorts by.
Downloading the indicator dictionary
Section titled “Downloading the indicator dictionary”Click the overflow menu in the indicator manager toolbar and select Download to export the full indicator dictionary. The CSV includes all fields: ID, label, type, DHIS2 id (for DHIS2 element indicators), DHIS2 name (the element or operand name read from DHIS2 when the indicator was created, blank for other types or when not available), members (for sums), formula (for calculated indicators), include-in-analysis flag, format, thresholds, direction, target, and expected-low-counts flag.
Importing a DHIS2 data import from the indicator manager
Section titled “Importing a DHIS2 data import from the indicator manager”With one or more indicators selected in the table, the HMIS data import bulk action opens the DHIS2 import wizard pre-configured with those indicators. A notice in the manager confirms that the import was started or scheduled, with a link to follow it under HMIS data, Imports.
Searching indicators
Section titled “Searching indicators”The search in the indicator manager matches every typed word against each indicator’s id, label, DHIS2 name, type, and definition. Searching by the DHIS2 name of an element is therefore supported without knowing the element’s UID.
Reserved words
Section titled “Reserved words”When creating or renaming an indicator ID, the ID must not contain commas, semicolons, colons, or square brackets, and must be at most 128 characters. It must also not be a reserved word. Reserved words include special indicator IDs (unless the indicator is a DHIS2 element, Uploaded, or Sum), population terms, and formula function names. The Special indicators and reserved words panel in the manager lists them all.
HFA indicators
Section titled “HFA indicators”Health Facility Assessment data works differently from HMIS. HFA surveys have custom question structures that vary by assessment, so HFA indicators require R code to extract values from raw survey data.
Defining HFA indicators
Section titled “Defining HFA indicators”Each HFA indicator has an indicator ID, category, sub-category, service categories, a short label, a definition, data type (binary or numeric), and aggregation method (sum or average). Keep indicator IDs short and consistent, like has_essential_medicines or staff_trained_count.
Indicator IDs must start with a letter and contain only letters, digits, and underscores, with a maximum of 64 characters. The app assigns each indicator’s ID automatically when you create it; the assigned ID is shown in the manager and code editor but cannot be changed after creation — other indicators may reference it in their R code, and renaming would break those references.
Indicator IDs must also not be reserved words. Reserved names include R functions and operators used in indicator code, as well as columns the analysis script generates (such as weight, time_point, and facility-related columns).
The service categories field is optional and provides an additional cross-cutting classification that is independent of the category/sub-category hierarchy. An indicator can belong to multiple service categories at once. Service categories are managed on their own tab in the HFA indicator manager and can be assigned to any indicator regardless of its category. When filtering visualizations or project data by service category, a match is made if the indicator belongs to any of the selected service categories — it does not need to belong to all of them.
Searching indicators
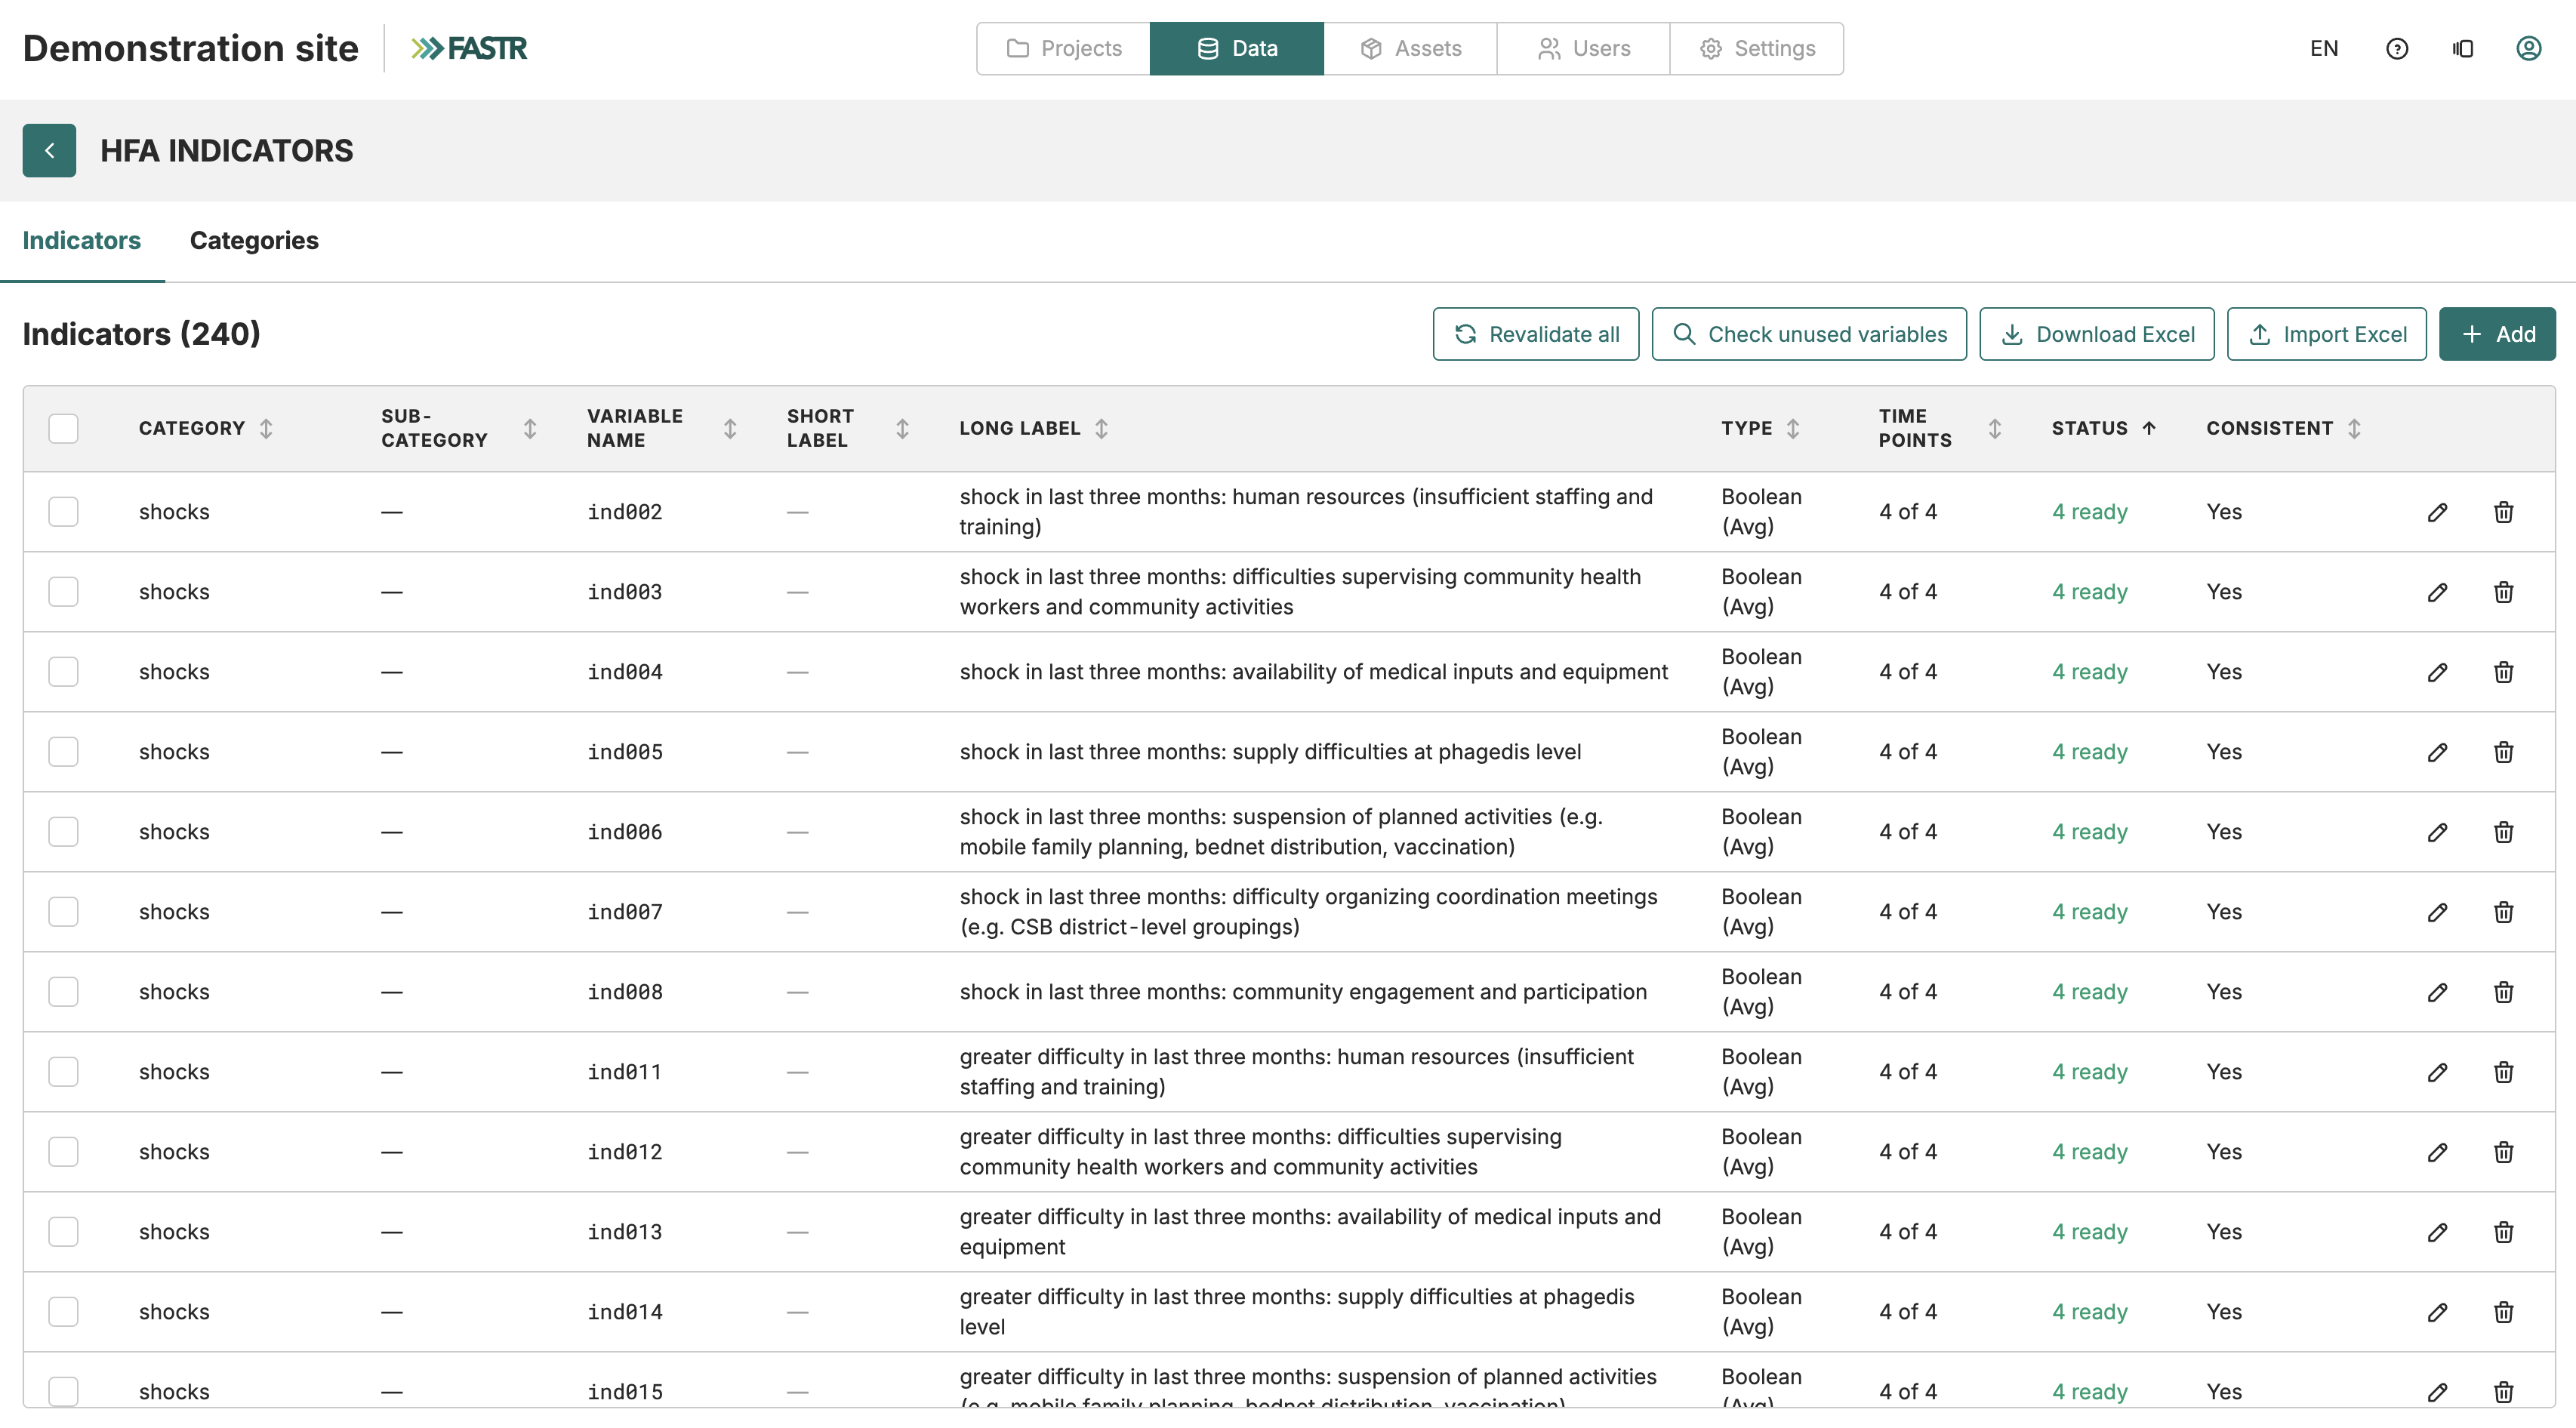
Section titled “Searching indicators”The HFA indicator manager includes a search field in the indicators panel header. Type any text to filter the indicator list by indicator ID, label, definition, category, sub-category, or service category. The count in the panel header updates to show how many indicators match your search out of the total. When no indicators match, the table shows “No indicators match your search.”
R code for extraction
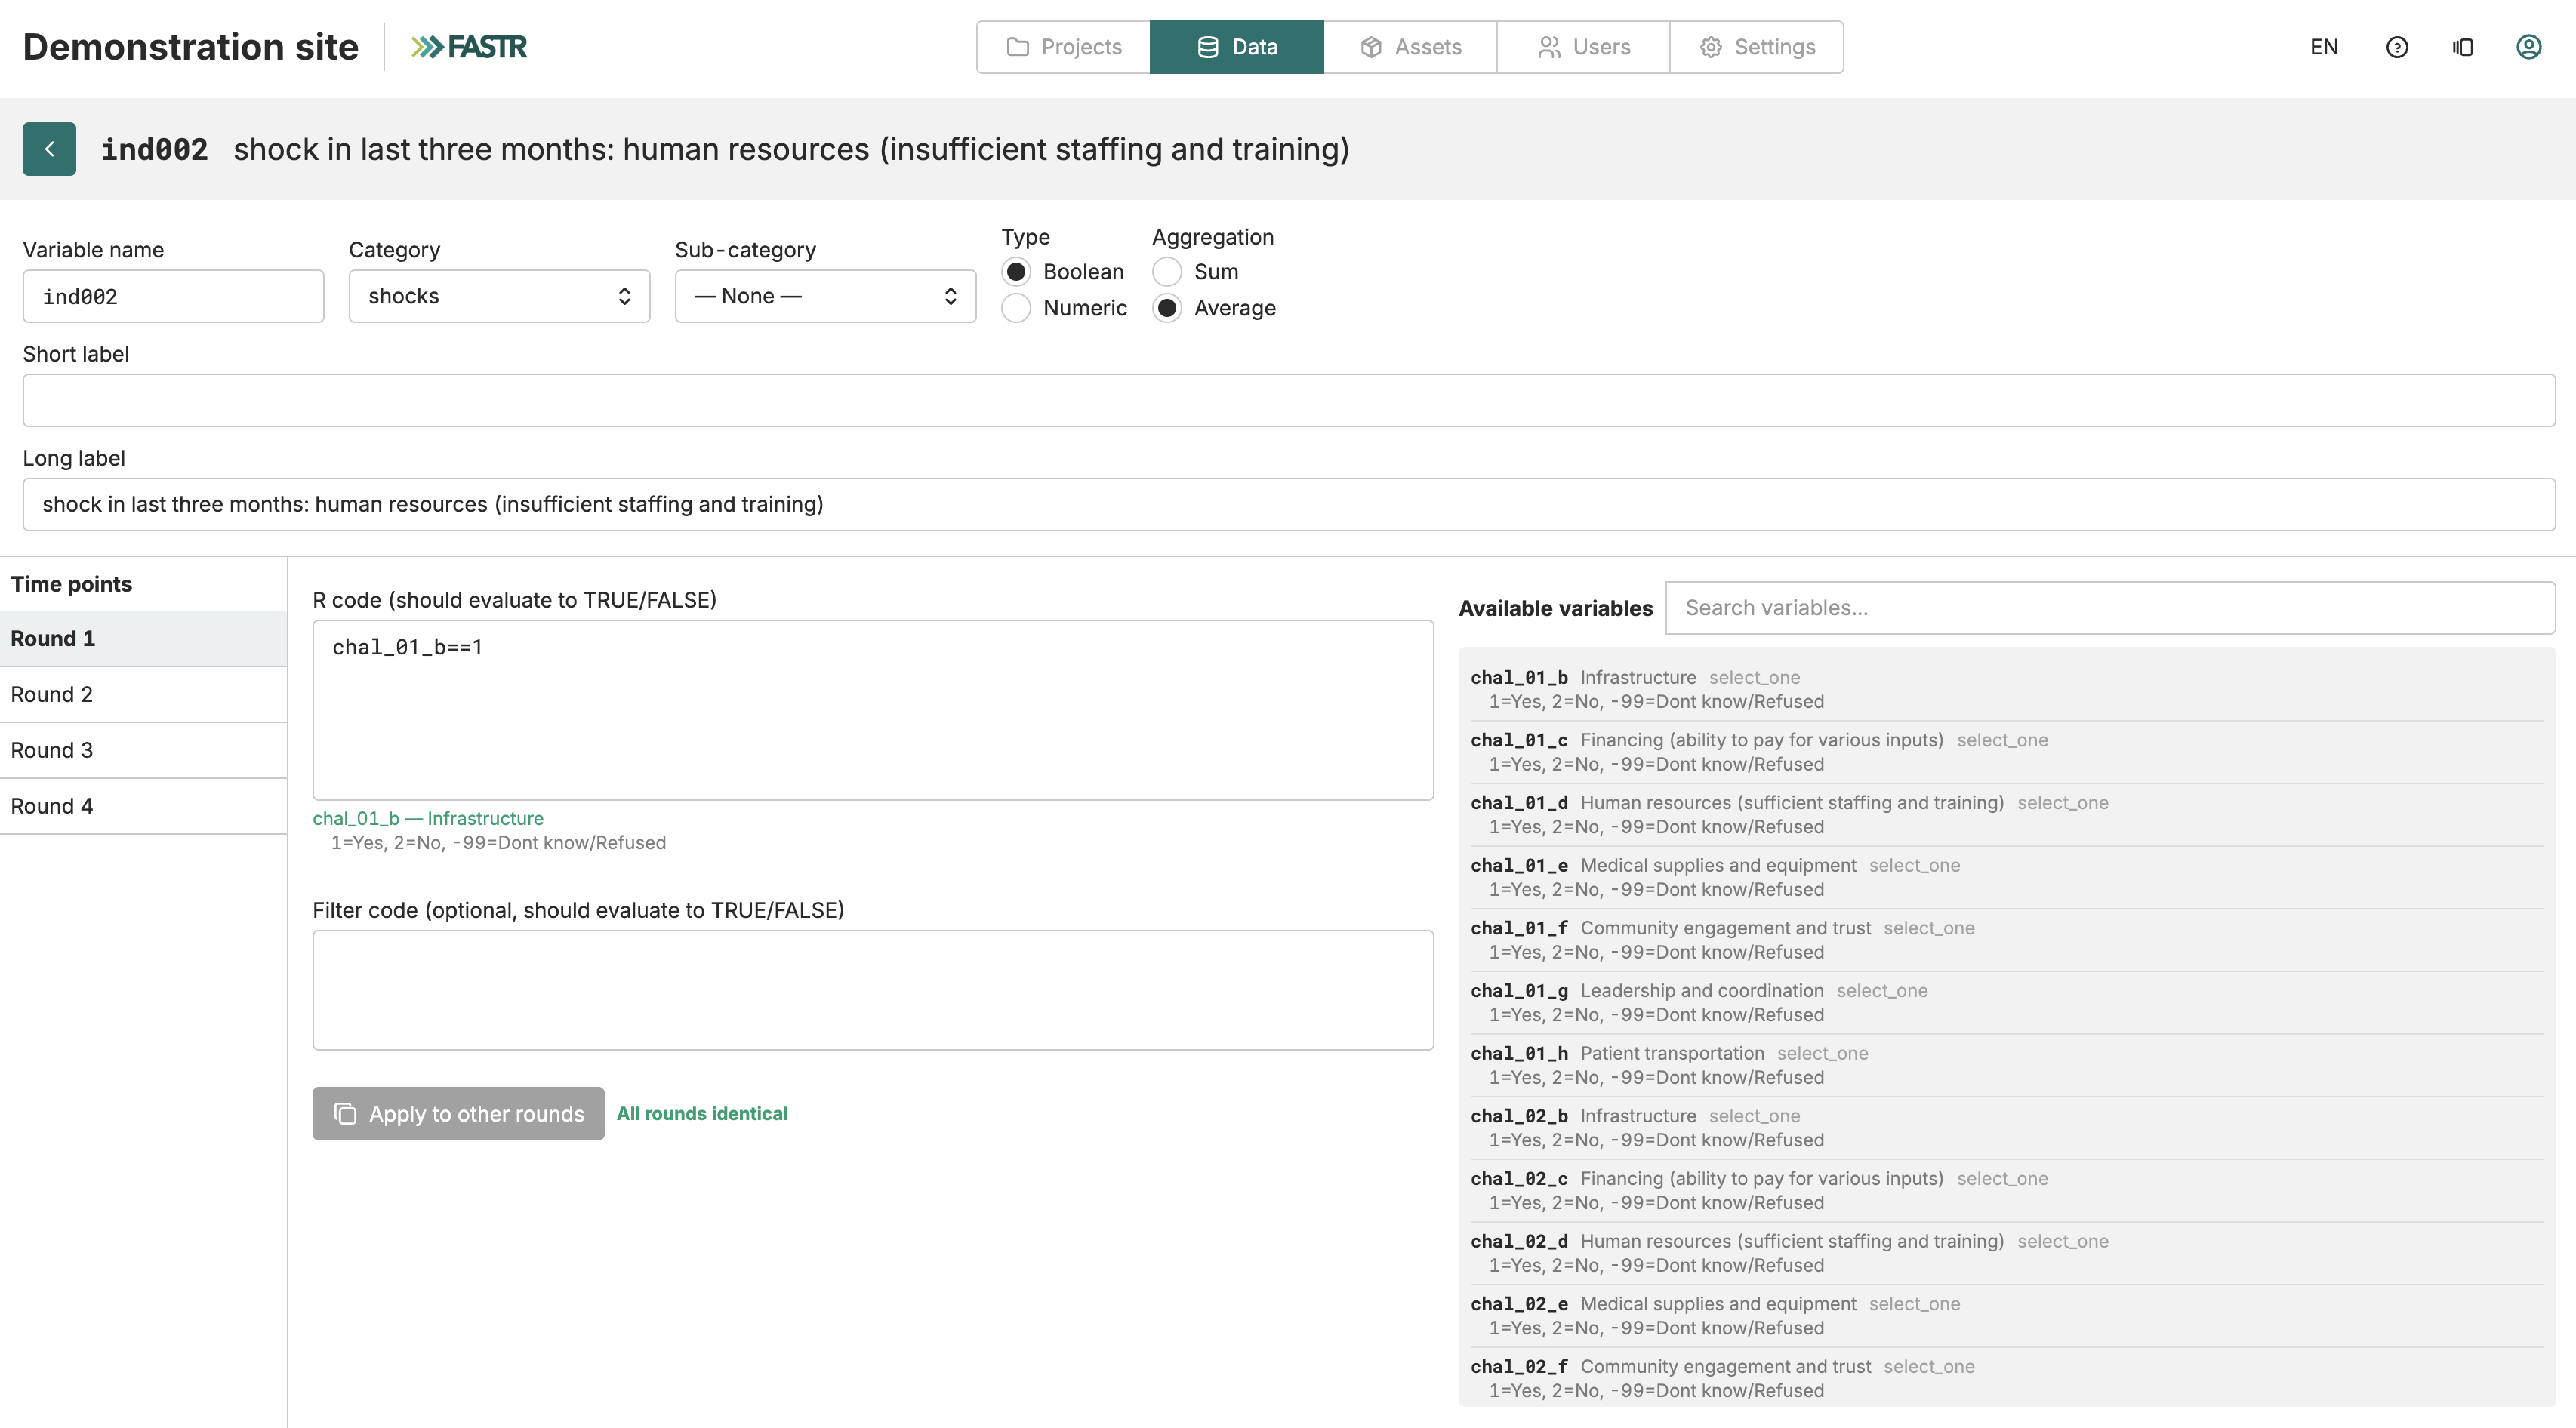
Section titled “R code for extraction”Each HFA indicator requires R code specifying how to extract its value from raw survey data. The code runs for each facility and should return TRUE/FALSE for binary indicators or a number for numeric ones.
The code editor shows which survey variables are available in your dataset at each time point, identified by their variable ID. If survey structure changed between assessments, you can write different code for different time points. FASTR validates syntax and flags unknown variables as errors, and warns about potential issues like lone = operators that may be unintended comparisons, or use of && and || operators that fail when the code runs across all facilities at once (use & and | instead). It also checks whether your code’s result type matches the indicator’s declared type — for example, a binary indicator whose code performs no comparison will show a type warning.
Warnings (shown in amber) are advisory and do not block saving. Errors (shown in red) — including syntax errors and references to variables not found in the dataset — do block the indicator from being marked as ready.
The code editor’s right-hand panel lists both survey variables and other indicators, so you can click any entry to insert its ID into the code at the cursor position. Use the search box to filter both lists at once.
Filter code
Section titled “Filter code”Each time-point code entry also supports an optional filter code field. Filter code restricts which facilities contribute to the indicator’s value — only facilities where the filter expression evaluates to TRUE are included. If you enter filter code for a time point, you must also provide R code for that same time point; a filter without R code is not valid and blocks saving.
Variant groups and per-item code
Section titled “Variant groups and per-item code”An indicator can be assigned to a variant group, which defines a set of response options (items) that the indicator can be broken down by. When a variant group is assigned, the code editor shows a per-item numerator section below the main code for each time point. Each item gets its own R code snippet that shares the time point’s filter code. Use this when the same indicator needs separate numerator logic for each response option — for example, separate calculations for each ownership category.
Variant groups and their items are managed on the Variant groups tab in the HFA indicator manager. Each item has a short ID (lowercase letters, digits, and underscores, starting with a letter, maximum 64 characters) and a display label. Items are ordered within their group and can be reordered by dragging.
To assign a variant group to an indicator, open the indicator’s code editor and select the group from the Variant group dropdown. If the indicator already has per-item code for a different group and you switch groups, FASTR asks for confirmation before clearing the old group’s code.
Code consistency
Section titled “Code consistency”When an indicator applies to multiple time points, FASTR tracks whether extraction code is consistent. Inconsistent code may be intentional (survey questions change between rounds), but it’s worth reviewing. Use Revalidate all after making changes to refresh validation across all indicators.
The indicator list shows a summary of code status: ready (no errors or warnings), warning (advisory issues only), and error (syntax or unknown-variable errors). The Revalidate all, Check unused variables, Download Excel, and Import Excel buttons are disabled when no HFA time points have been defined yet, because those actions depend on the survey data dictionary. Add a time point from HFA → Time points to enable them.
Importing default indicators
Section titled “Importing default indicators”The HFA indicator manager includes an Import default indicators button alongside the Import Excel button. Clicking it fetches the standard FASTR HFA indicator set directly from the FASTR resource hub on GitHub — no file selection required. The form shows how many indicators and categories were retrieved before you confirm the import. You choose the same import modes as with a file upload: Add to existing adds only new indicator IDs, while Replace all existing deletes all current indicators before importing.
Deleting indicators
Section titled “Deleting indicators”Before deleting an indicator or a set of indicators, FASTR checks whether any other indicators reference the deleted indicator IDs in their R code or variant code. If references are found, the confirmation dialog lists the affected indicators and warns that their code will fail validation after deletion.
AI assistant for indicators
Section titled “AI assistant for indicators”Global administrators can open an AI assistant panel directly in the HFA Indicator Manager by clicking the AI button. The button appears in the top bar of the manager and also in the header of the code editor and the Excel workbook upload form when the panel is not already open. The assistant can clean up labels, organise indicators into categories, and create new indicators from the underlying survey dataset. It reads and writes indicators through a set of dedicated tools — loading current state before proposing changes, validating R code against the data dictionary, and showing a confirmation dialog with a diff before any edits are applied. When the assistant creates new indicators, the app assigns each indicator’s ID automatically and returns it in the result. When applying bulk updates, all changes are sent to the server in a single transactional operation: either all indicators are updated or none are, so a partial failure cannot leave the dataset in an inconsistent state. The assistant operates on instance-level HFA indicators and is fully isolated from the project AI assistant.
Managing service categories
Section titled “Managing service categories”Service categories are created and managed from the Service categories tab in the HFA indicator manager. Click Add to create a new service category - you provide a label and FASTR derives an ID automatically, though you can edit it. You can reorder service categories by dragging, and edit or delete them individually. Deleting a service category removes it from any indicators currently assigned to it. Note that service category IDs cannot contain the pipe character (|).
Managing variant groups
Section titled “Managing variant groups”Variant groups are created and managed from the Variant groups tab in the HFA indicator manager. The tab shows a two-panel layout: groups on the left and the selected group’s items on the right.
Click Add in the groups panel to create a new group — provide a label and FASTR derives an ID automatically. You can reorder groups by dragging. Click the pencil icon to edit a group’s label, or the trash icon to delete it. Deletion is refused while any indicator is still assigned to the group.
Select a group to manage its items in the right panel. Click Add to create a new item — provide a label and FASTR derives an ID from it, though you can edit the ID before saving. Item IDs must start with a lowercase letter and contain only lowercase letters, digits, and underscores (maximum 64 characters). You can reorder items within a group by dragging. Edit or delete individual items using the icons on each row; deleting an item removes any per-item code authored for it.
Excel workbook upload
Section titled “Excel workbook upload”HFA indicators support batch creation via Excel workbook. Upload an Excel workbook (.xlsx) with these sheets:
- Categories: id, label
- Sub-categories: id, categoryId, label
- Service categories: id, label (optional)
- Variant groups: id, label (optional)
- Variant items: id, groupId, label (optional)
- Indicators: indicatorId (leave blank for a new indicator; the app assigns one), categoryId, subCategoryId, serviceCategoryId (pipe-separated for multiple), shortLabel, definition, type, aggregation, variantGroupId (optional), r_code__<time point>, r_filter_code__<time point>, r_variant_code__<itemId>__<time point>, …
If the Service categories, Variant groups, or Variant items sheets are omitted, indicators are imported with no service categories or variant assignments.
Variant code columns use the format r_variant_code__<itemId>__<timePointLabel>. Each variant code column must reference an item ID from the Variant items sheet, and the time point label must match a labeled r_code__ column in the same file. An indicator with variant code must also have a variantGroupId that matches the item’s group.
When importing, choose between Add to existing and Replace all existing import modes. In Add to existing mode, indicators whose IDs already exist on the platform are skipped — only new IDs are created. After import, a summary lists any skipped indicators. In Replace all existing mode, all existing indicators, categories, sub-categories, and service categories are permanently deleted before importing. To confirm a replace-all import, you must type yes please delete in the confirmation field before the Import button becomes active.
FASTR detects the time point columns embedded in the file and presents a mapping step where you confirm which platform time point each column should import into. If the column labels match your platform time points exactly, the mapping is pre-filled automatically. Each platform time point can only receive one workbook column — mapping two columns to the same time point is rejected.
XLSForm variable labels
Section titled “XLSForm variable labels”When FASTR reads your XLSForm questionnaire during an HFA import, it constructs labels for variables using the survey structure. For most variables the label is simply the question text. For variables inside matrix question groups (ODK begin_group or begin_repeat blocks), FASTR qualifies the label with the immediate enclosing group’s label, separated by ” — ”. For example, a child question labelled “Infrastructure” inside a group labelled “Block B: Challenges” becomes “Block B: Challenges — Infrastructure”. This ensures that matrix children, which often share identical question text across multiple groups, are identifiable in the data dictionary and in visualizations.
For “select_multiple” questions, the expanded binary variables follow the same pattern: the composed variable label is joined to the choice label with the same ” — ” separator.
FASTR also strips HTML markup and normalizes whitespace from XLSForm labels before storing them, so labels authored with on-screen formatting appear cleanly in the dictionary.
Best practices
Section titled “Best practices”Choose indicator IDs that are short but descriptive. Avoid spaces and special characters - stick to lowercase letters, numbers, and underscores.
For calculated indicators, document your formula choices — future analysts will want to understand what each term represents and why specific population types were chosen.