
User guide
The FASTR platform helps health program managers and analysts turn routine health data into actionable insights. This guide covers the day-to-day tasks you’ll perform as a user - navigating projects, understanding analytical outputs, creating visualizations, and building reports.
Who this guide is for
Section titled “Who this guide is for”This section is written for anyone who works with FASTR analytical outputs. That includes program officers reviewing performance data, data analysts creating custom visualizations, and managers preparing reports for stakeholders. You don’t need to manage users, upload data, or configure system settings - those tasks are covered in the Admin guide.
Your role in FASTR determines what you can do. Viewers can browse visualizations and export reports but can’t make changes. Editors can create and modify visualizations, build slide decks, and save their work. Admins have full access including module configuration and project settings. Your administrator assigns these roles when they add you to a project.
What you’ll need
Section titled “What you’ll need”Before diving in, make sure you can sign in to your organization’s FASTR instance. Your administrator should have sent you an invitation email with instructions. If you’re having trouble accessing the platform, contact your administrator - they can verify your account status and permissions.
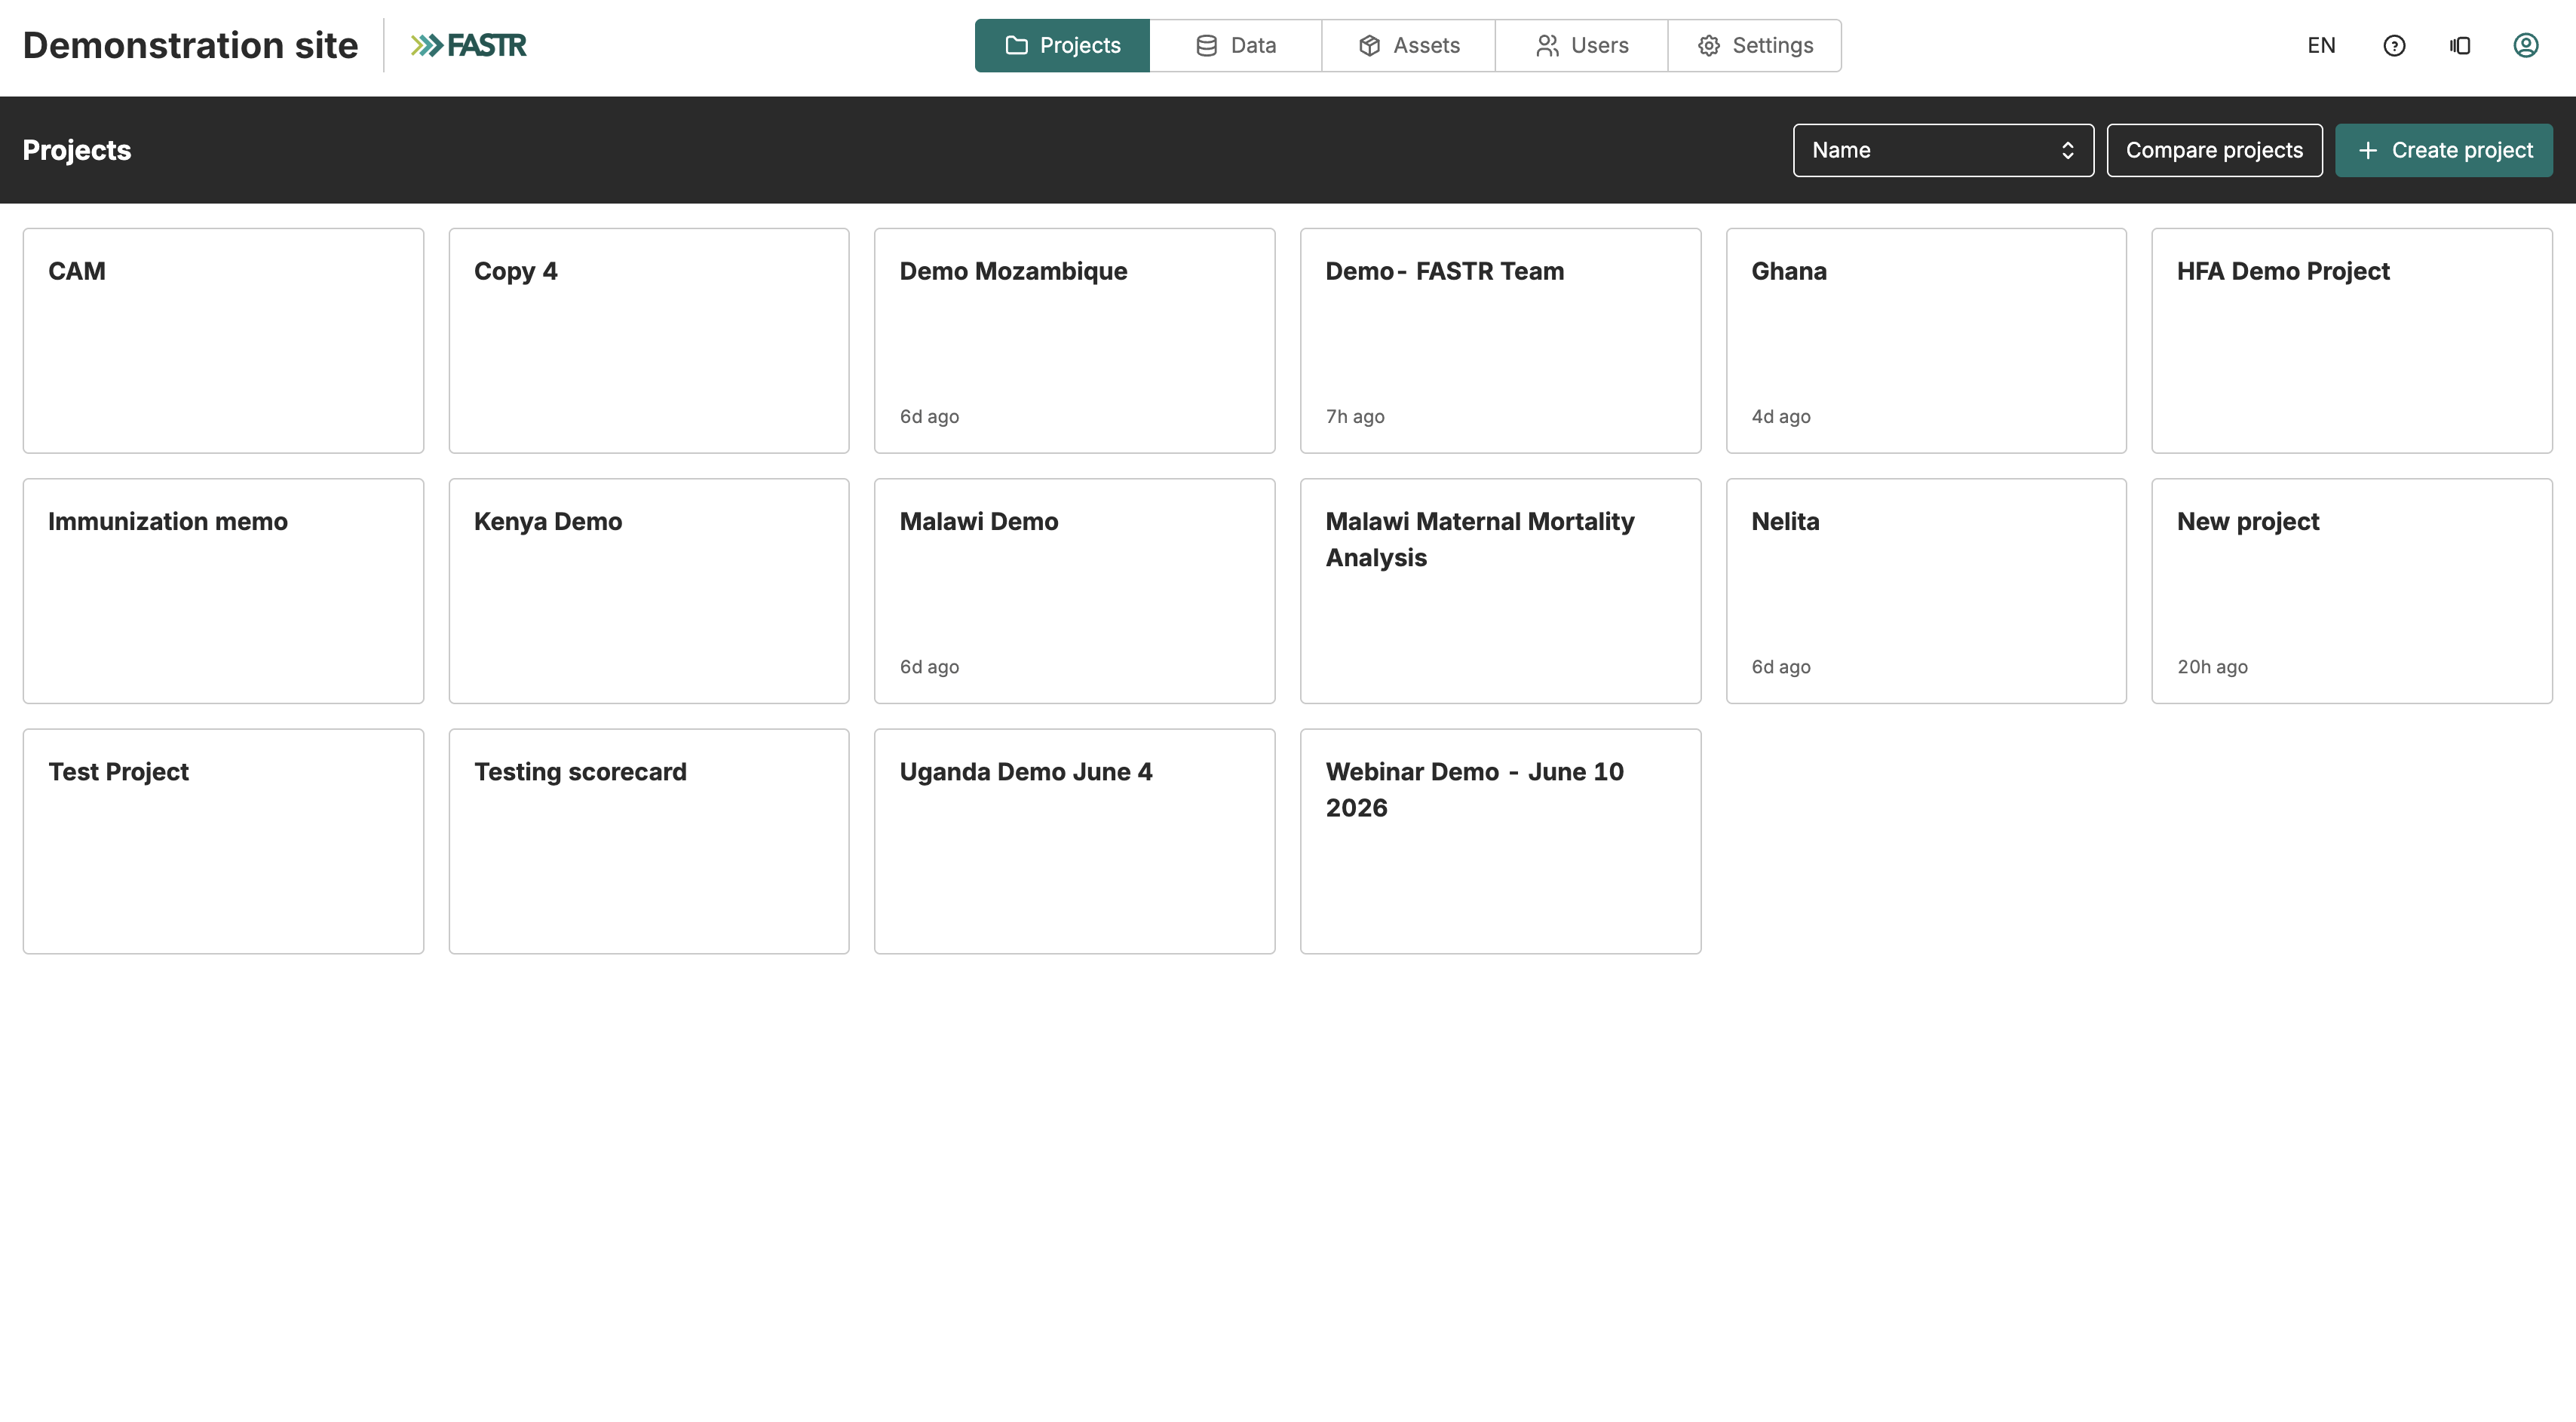
You’ll also need access to at least one project. Projects are workspaces where data, modules, and visualizations come together. If you can sign in but don’t see any projects on your landing page, ask your administrator to add you to the relevant project.
How FASTR works
Section titled “How FASTR works”Understanding the platform’s structure will help you navigate it more effectively. FASTR organizes work around three main concepts.
Projects are self-contained analytical workspaces. Each project pulls a specific subset of your organization’s data - perhaps a particular time period, set of districts, or group of indicators. Everything you create in a project uses that data window, which ensures consistency across all outputs.
Modules are the analytical engines that process your data. They run R scripts that transform raw health data into meaningful outputs - coverage rates, quality scores, trend analyses, and more. You don’t need to write code yourself; modules produce results automatically once configured by an administrator.
Visualizations turn module outputs into charts, maps, and tables you can explore, customize, and share. They’re the primary way you’ll interact with analytical results day-to-day.
What’s New announcements
Section titled “What’s New announcements”When FASTR is updated, a bell icon appears in the top navigation bar. A yellow dot on the bell means there are unread release announcements. Click the bell to browse all announcements, or click through to any individual post to read the full details. New announcements may also appear automatically when you sign in after an update.
Getting help
Section titled “Getting help”Click Help in the top navigation bar to open a menu with several options. Guided tours walks you through key areas of the platform step by step and can be replayed at any time. Ask for help sends a support request to the FASTR team. Send feedback lets you report a bug, a suggestion, or ask a general question. Documentation opens this documentation site.
In this section
Section titled “In this section”The following pages walk through each part of the platform in more detail.
- Projects - Navigating projects and understanding data windows
- Modules - Understanding module outputs and results
- Visualizations - Creating and customizing charts, maps, and tables
- Dashboards - Assembling visualizations into live, shareable dashboards
- Slide decks - Building presentations and exporting documents
- Reports - Writing long-form documents with embedded live figures
- AI assistant - Getting help interpreting your data
Start with Projects if you’re new to FASTR. If you already know your way around and want to create a specific output, jump directly to Visualizations, Dashboards, Slide decks, or Reports.