
Reports
Reports are long-form documents you write inside FASTR - a quarterly review, a country brief, an analytical narrative. You write the text in markdown and drop in live figures from your visualizations, so the charts in the document stay tied to your data instead of being pasted-in pictures that go stale. When the report is ready, export it as a PDF or a Word document.
A report is the right tool when you need prose around your numbers. If you mainly want charts on a page, a dashboard fits better; if you’re presenting to a room, a slide deck does. Reports are for the written word.
Creating a report
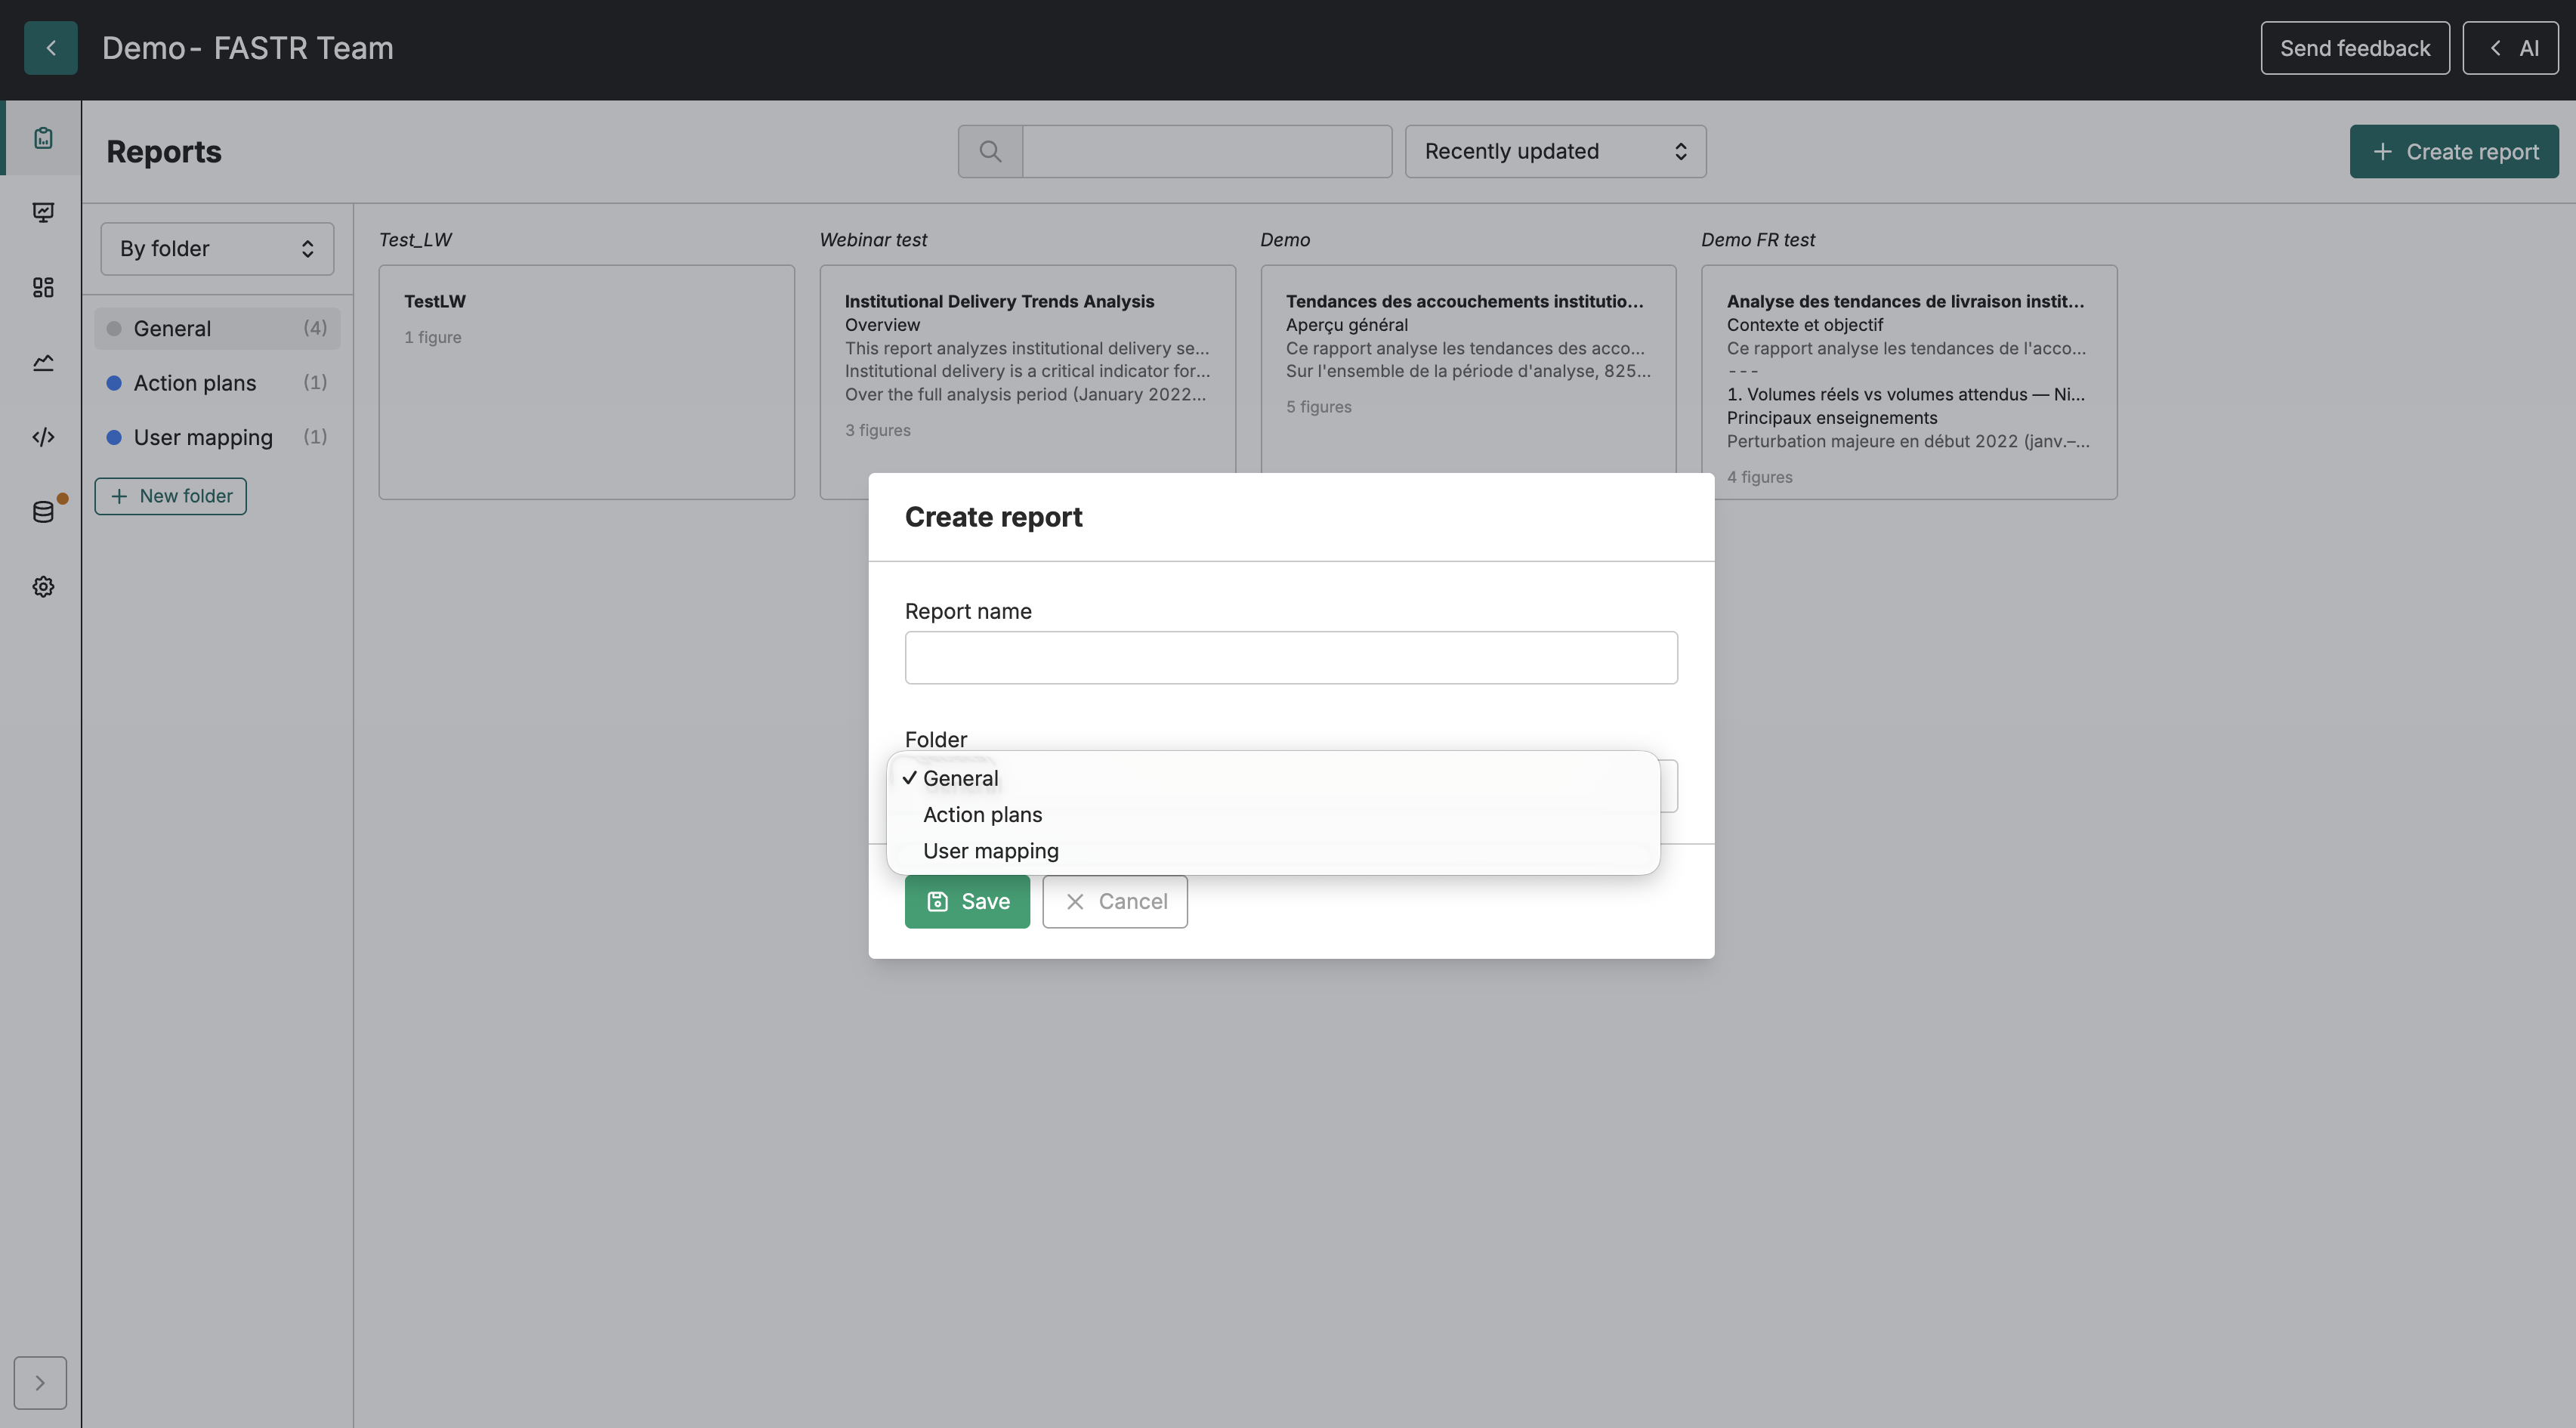
Section titled “Creating a report”Open your project and go to the Reports section. Each report appears as a card showing a preview of its opening lines and a count of the figures and images inside, which makes it easy to find the one you want. Right-click a card to move it to a folder, duplicate it, or delete it.
Click Create report, give it a name, and optionally choose a folder. The report opens straight into the editor, ready to write.
Writing in the editor
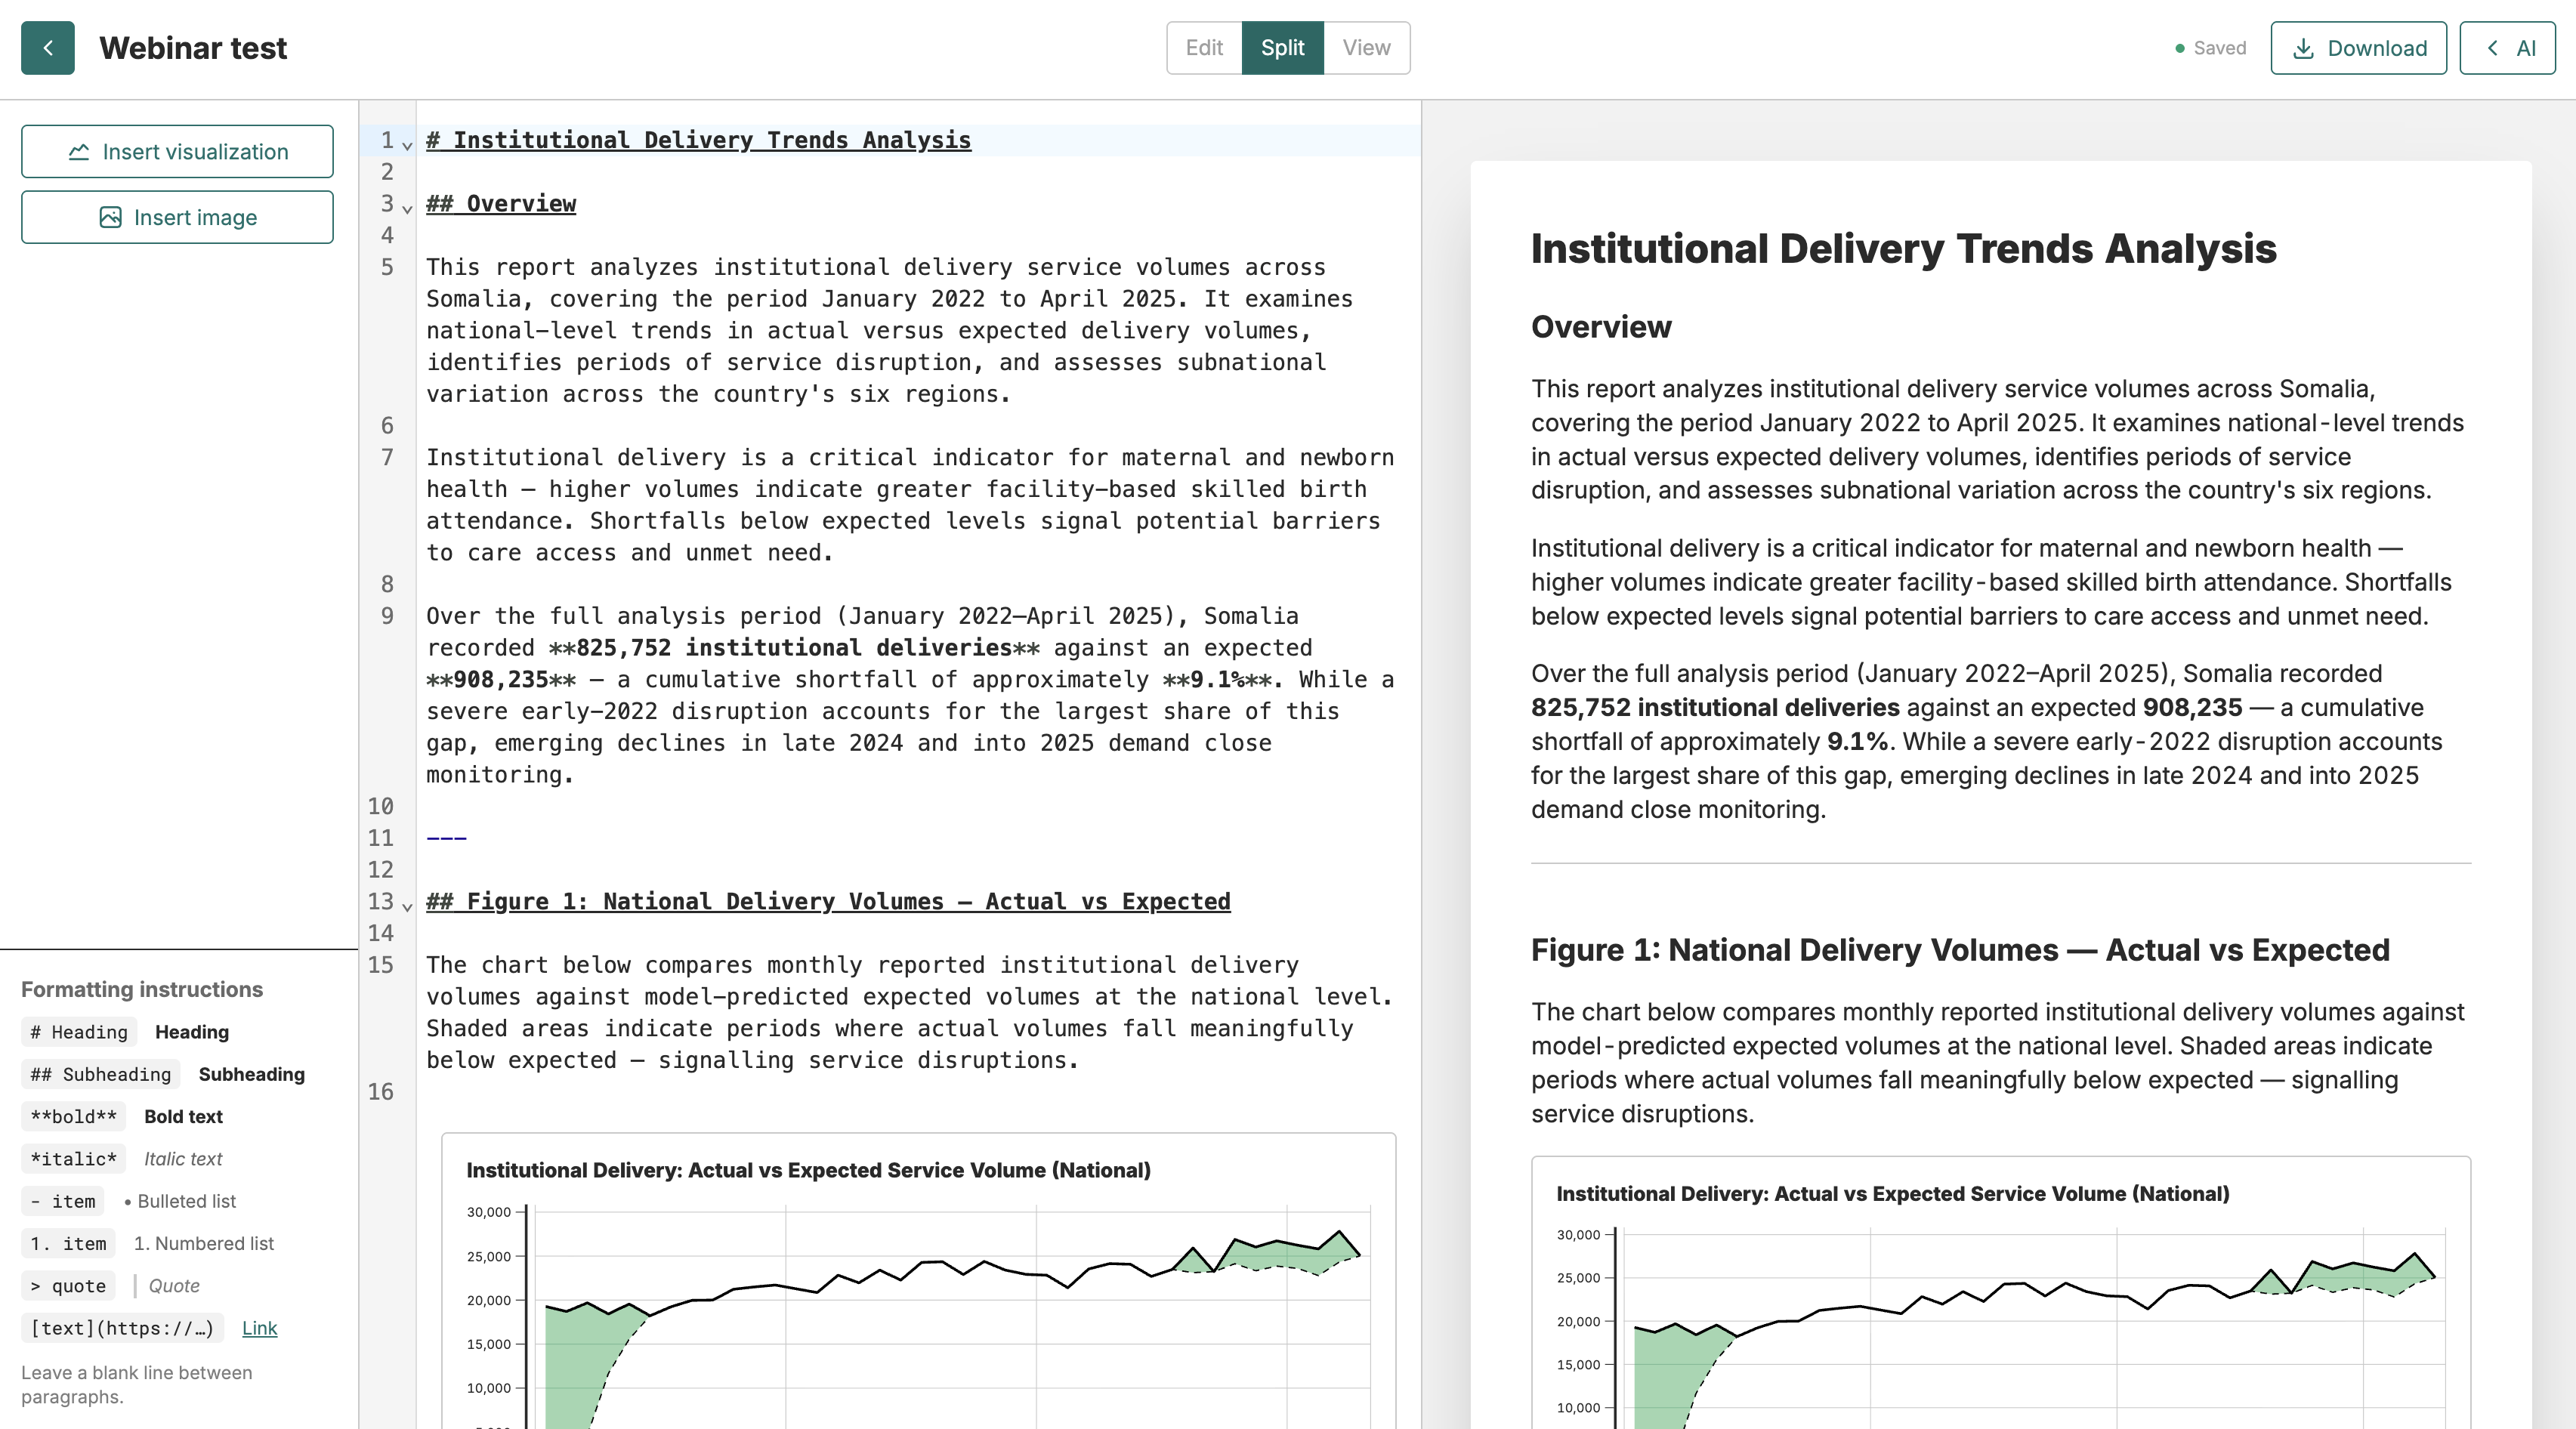
Section titled “Writing in the editor”The editor uses markdown, so you write plain text and format it with simple marks - # for headings, - for bullet lists, 1. for numbered lists, and pipes for tables. Bold, italic, and inline code work the way they do anywhere else. If markdown is new to you, you only need the basics; headings and lists cover most of what a report needs.
Your work saves on its own as you type. A status indicator in the header shows where things stand - Saving while a change is in flight, Saved with the time of the last save once it lands, and a clear error state if a save ever fails so you know to check your connection rather than lose work.
When live collaboration is active, the save indicator changes: it shows Live with a green dot while edits are streaming to the server continuously, Offline — reconnecting… with a yellow dot if the connection drops, and Not saving — retrying… with a red dot if the server-side checkpoint is failing. In Live mode the REST autosave is replaced by the room’s continuous checkpoint, so the indicator no longer cycles through Saving/Saved.
Edit and View modes
Section titled “Edit and View modes”The header has an Edit / Split / View toggle. Edit shows the markdown editor with the writing tools. Split shows the editor and rendered preview side by side. View renders the report the way it will read when finished - formatted headings, lists, tables, and live figures. Switch to View to proofread or to show someone the result without the editing controls in the way; the figures stay interactive there too.
Adding figures and images
Section titled “Adding figures and images”Reports hold two kinds of visual content, and the difference matters. A figure is a live visualization from your project - it renders from current data and updates when that data changes. An image is a static file you upload, such as a diagram or a photo.
To add a figure, click Insert figure and pick a visualization. To add a picture, click Insert image and upload a file or choose one from your project’s assets. Either way, the item appears in the document as a card you can select.
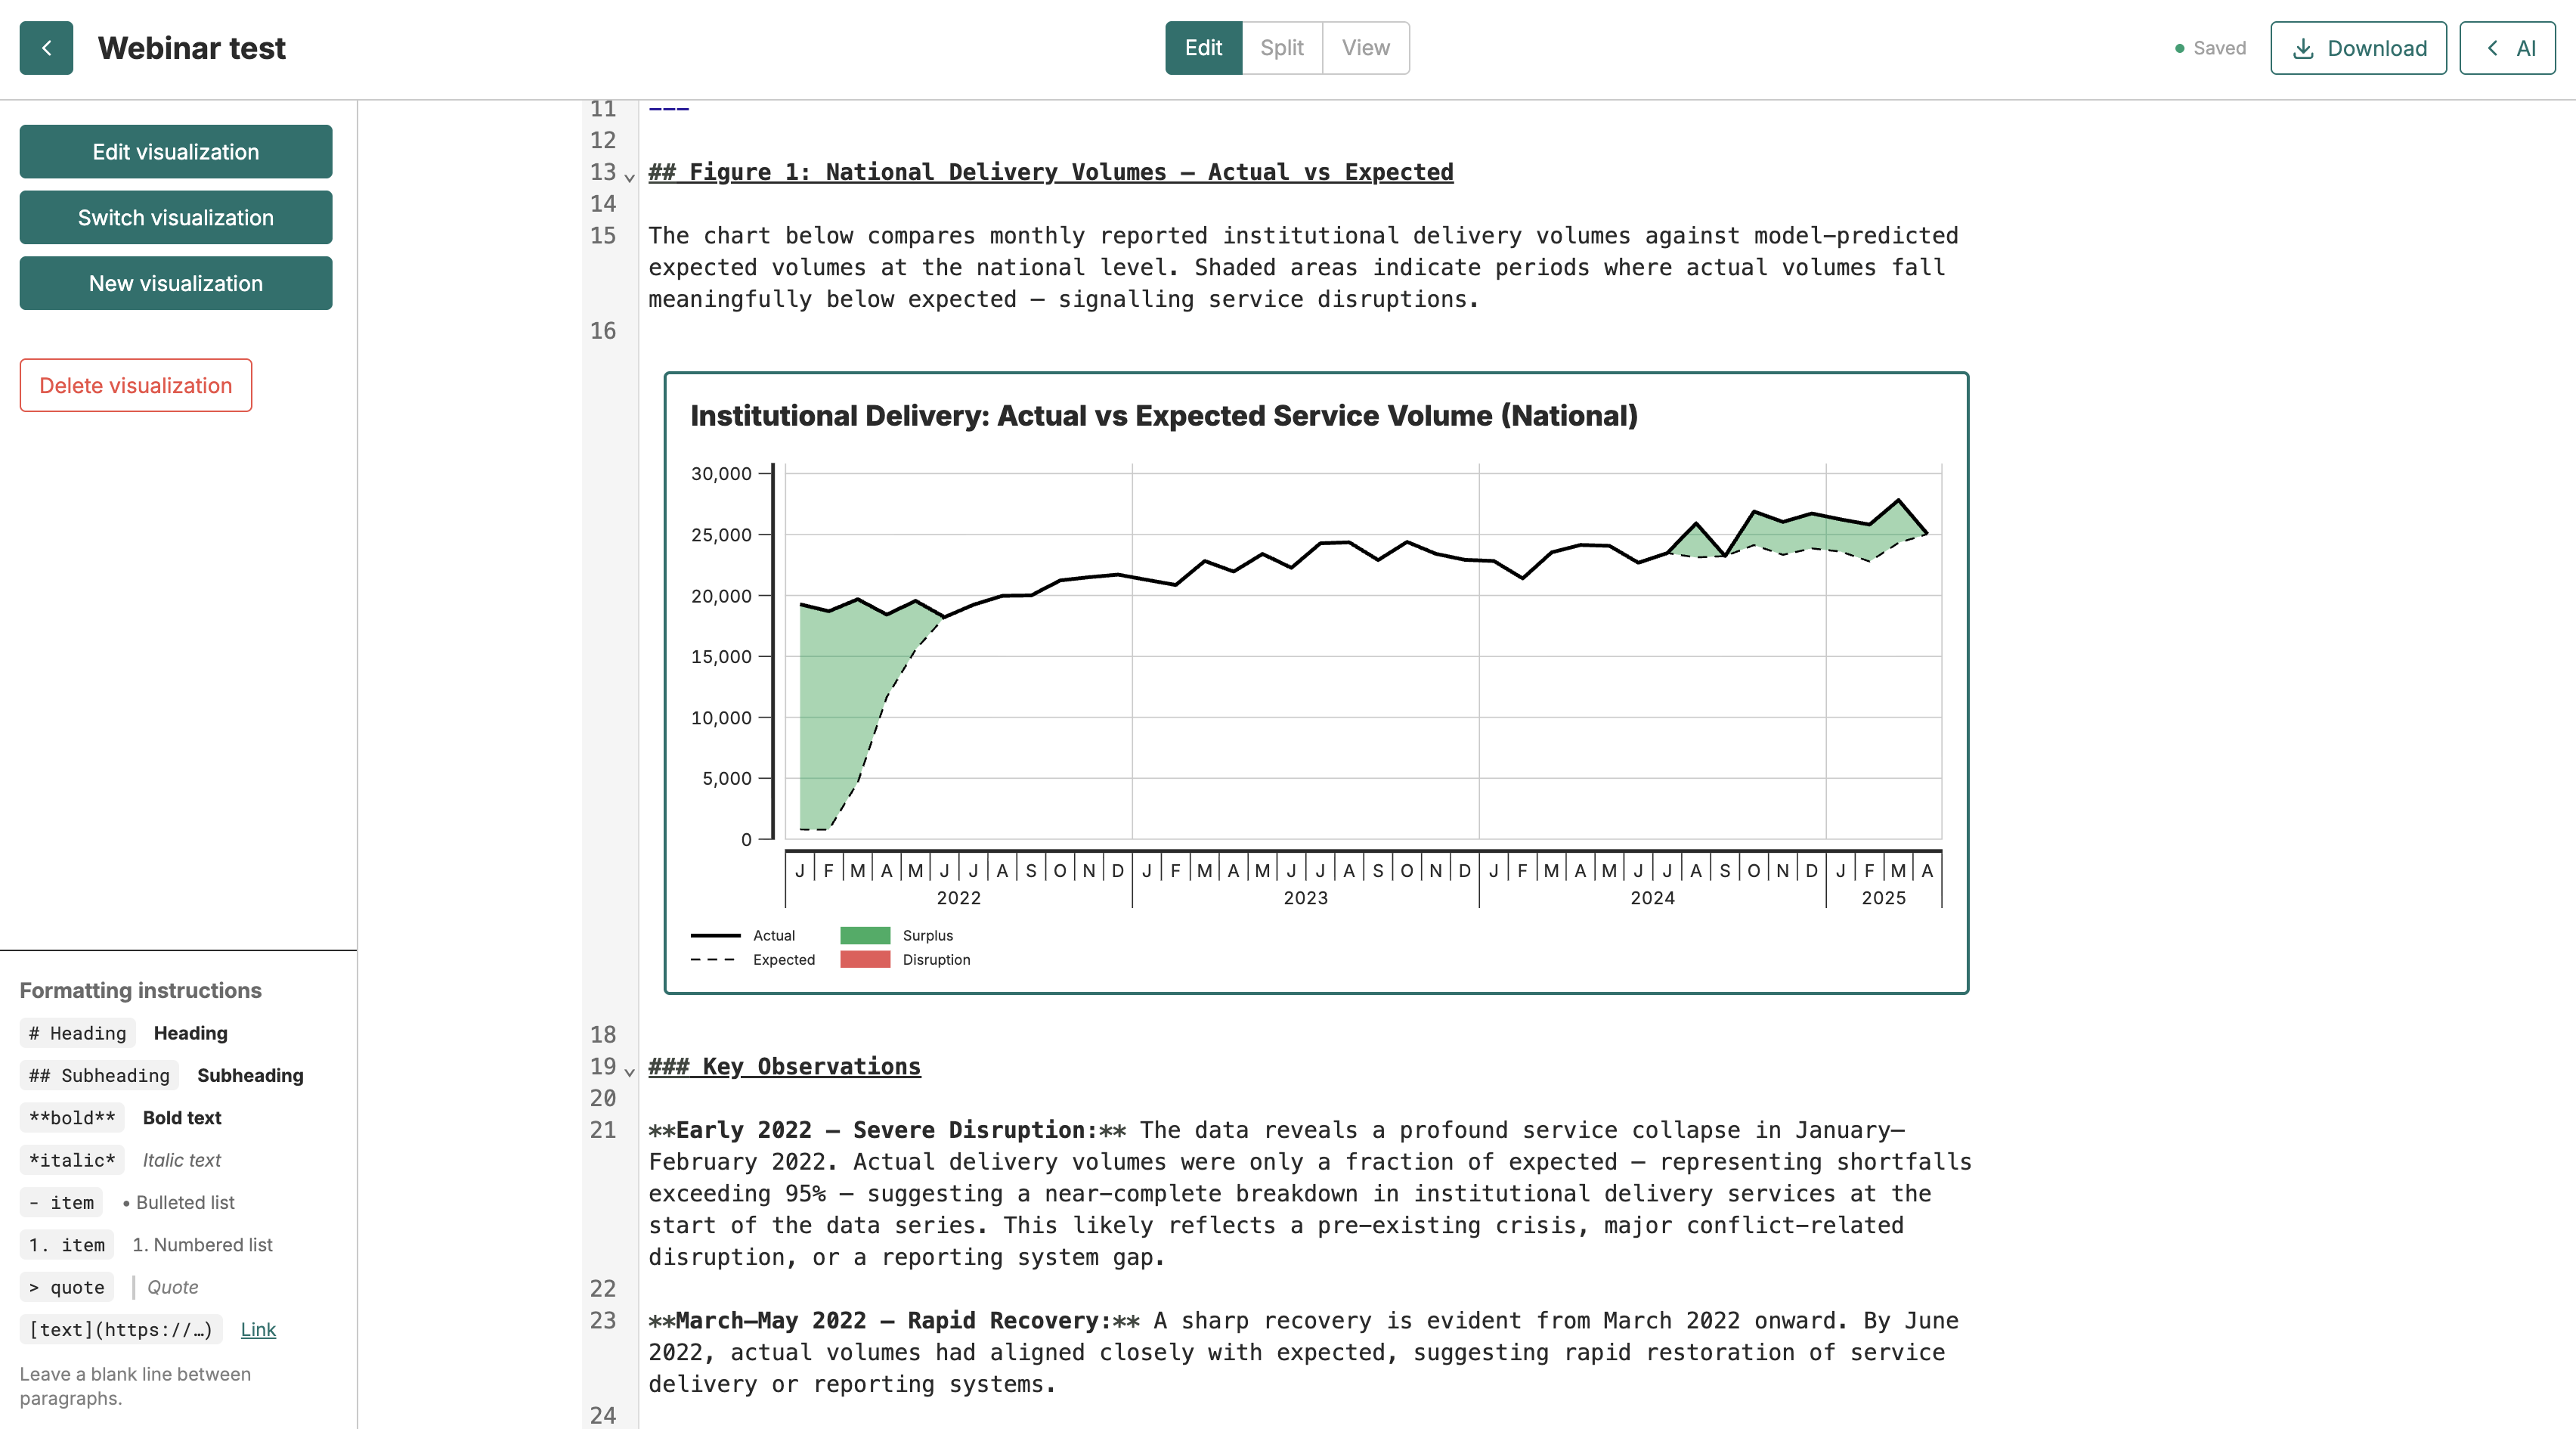
Selecting a figure or image opens a panel on the left for working with it:
- Caption sets the text shown with the figure or image
- Edit visualization opens the figure’s settings - adjust the period, disaggregation, or styling
- Switch visualization replaces the figure with a different one
- Create new visualization builds a fresh visualization and embeds it in place
- Delete removes the figure or image from the report
Because figures stay linked to their visualizations, a report you wrote last quarter shows this quarter’s numbers the next time you open it - no manual updating, no re-pasting charts.
If a figure or image cannot be loaded when you export the report, FASTR replaces it with a short notice in place of the missing item rather than aborting the export. The rest of the report exports normally.
Collaborating on a report
Section titled “Collaborating on a report”When multiple people have the same report open, you can see where colleagues are working. Live cursors appear on both the code editor pane and the rendered preview, so you know at a glance whether someone else is editing the section you are about to change. A small presence avatar also appears on the report card in the list view. Collaborators who are currently viewing the same report appear as avatar icons in the header.
The editor is collaborative: remote collaborators’ text selections are highlighted in their color, and hovering over a highlighted selection shows the person’s name. When the AI assistant proposes a text edit that you accept, the change is rebased over any concurrent edits your colleagues made while the proposal was open - if a hunk could not be applied cleanly, the assistant lets you know which lines were skipped.
When a collaborator has a figure selected, a colored presence border appears around that figure in both the editor and preview panes, with their name shown above it. If they have the figure’s visualization editor open, the border is labeled with an edit indicator so others know the figure configuration is being actively changed.
Version history
Section titled “Version history”Click History in the report header to open the version history panel. Versions are saved automatically at the end of each editing session and grouped by day on the left side. Select any version to see a diff of what that session changed - added text is highlighted in the editor’s color, removed text is shown struck through, and hovering over a change shows who made it.
From the version preview you can also switch to a Preview view that renders the full report snapshot as it looked at that point. Use Restore to reset the report to that version (your current content is saved as a new version first, so nothing is lost), or Restore as copy to create a brand-new report from the snapshot while leaving the current one untouched.
If the report has unsaved live edits that cannot be saved at the moment you request a restore, FASTR will let you know and ask you to retry once saving has recovered.
AI assistance
Section titled “AI assistance”The AI button opens an assistant that can help as you write. It can rewrite a passage you’ve selected, insert or replace figures, and edit existing figures directly without rebuilding them from scratch - for example, changing the replicant a chart displays, adjusting its filters, or updating captions. The assistant proposes text changes for you to accept or reject in a modal before anything is applied; figure edits are applied immediately to the live preview and saved. See AI assistant for the full picture.
Undo and redo
Section titled “Undo and redo”The report header includes Undo and Redo buttons that reverse your own body-text changes without affecting your colleagues’ edits. These buttons appear only in Edit and Split modes, and only when you have permission to edit the report. They operate the same history as the keyboard shortcuts Ctrl+Z and Ctrl+Shift+Z inside the editor.
Exporting
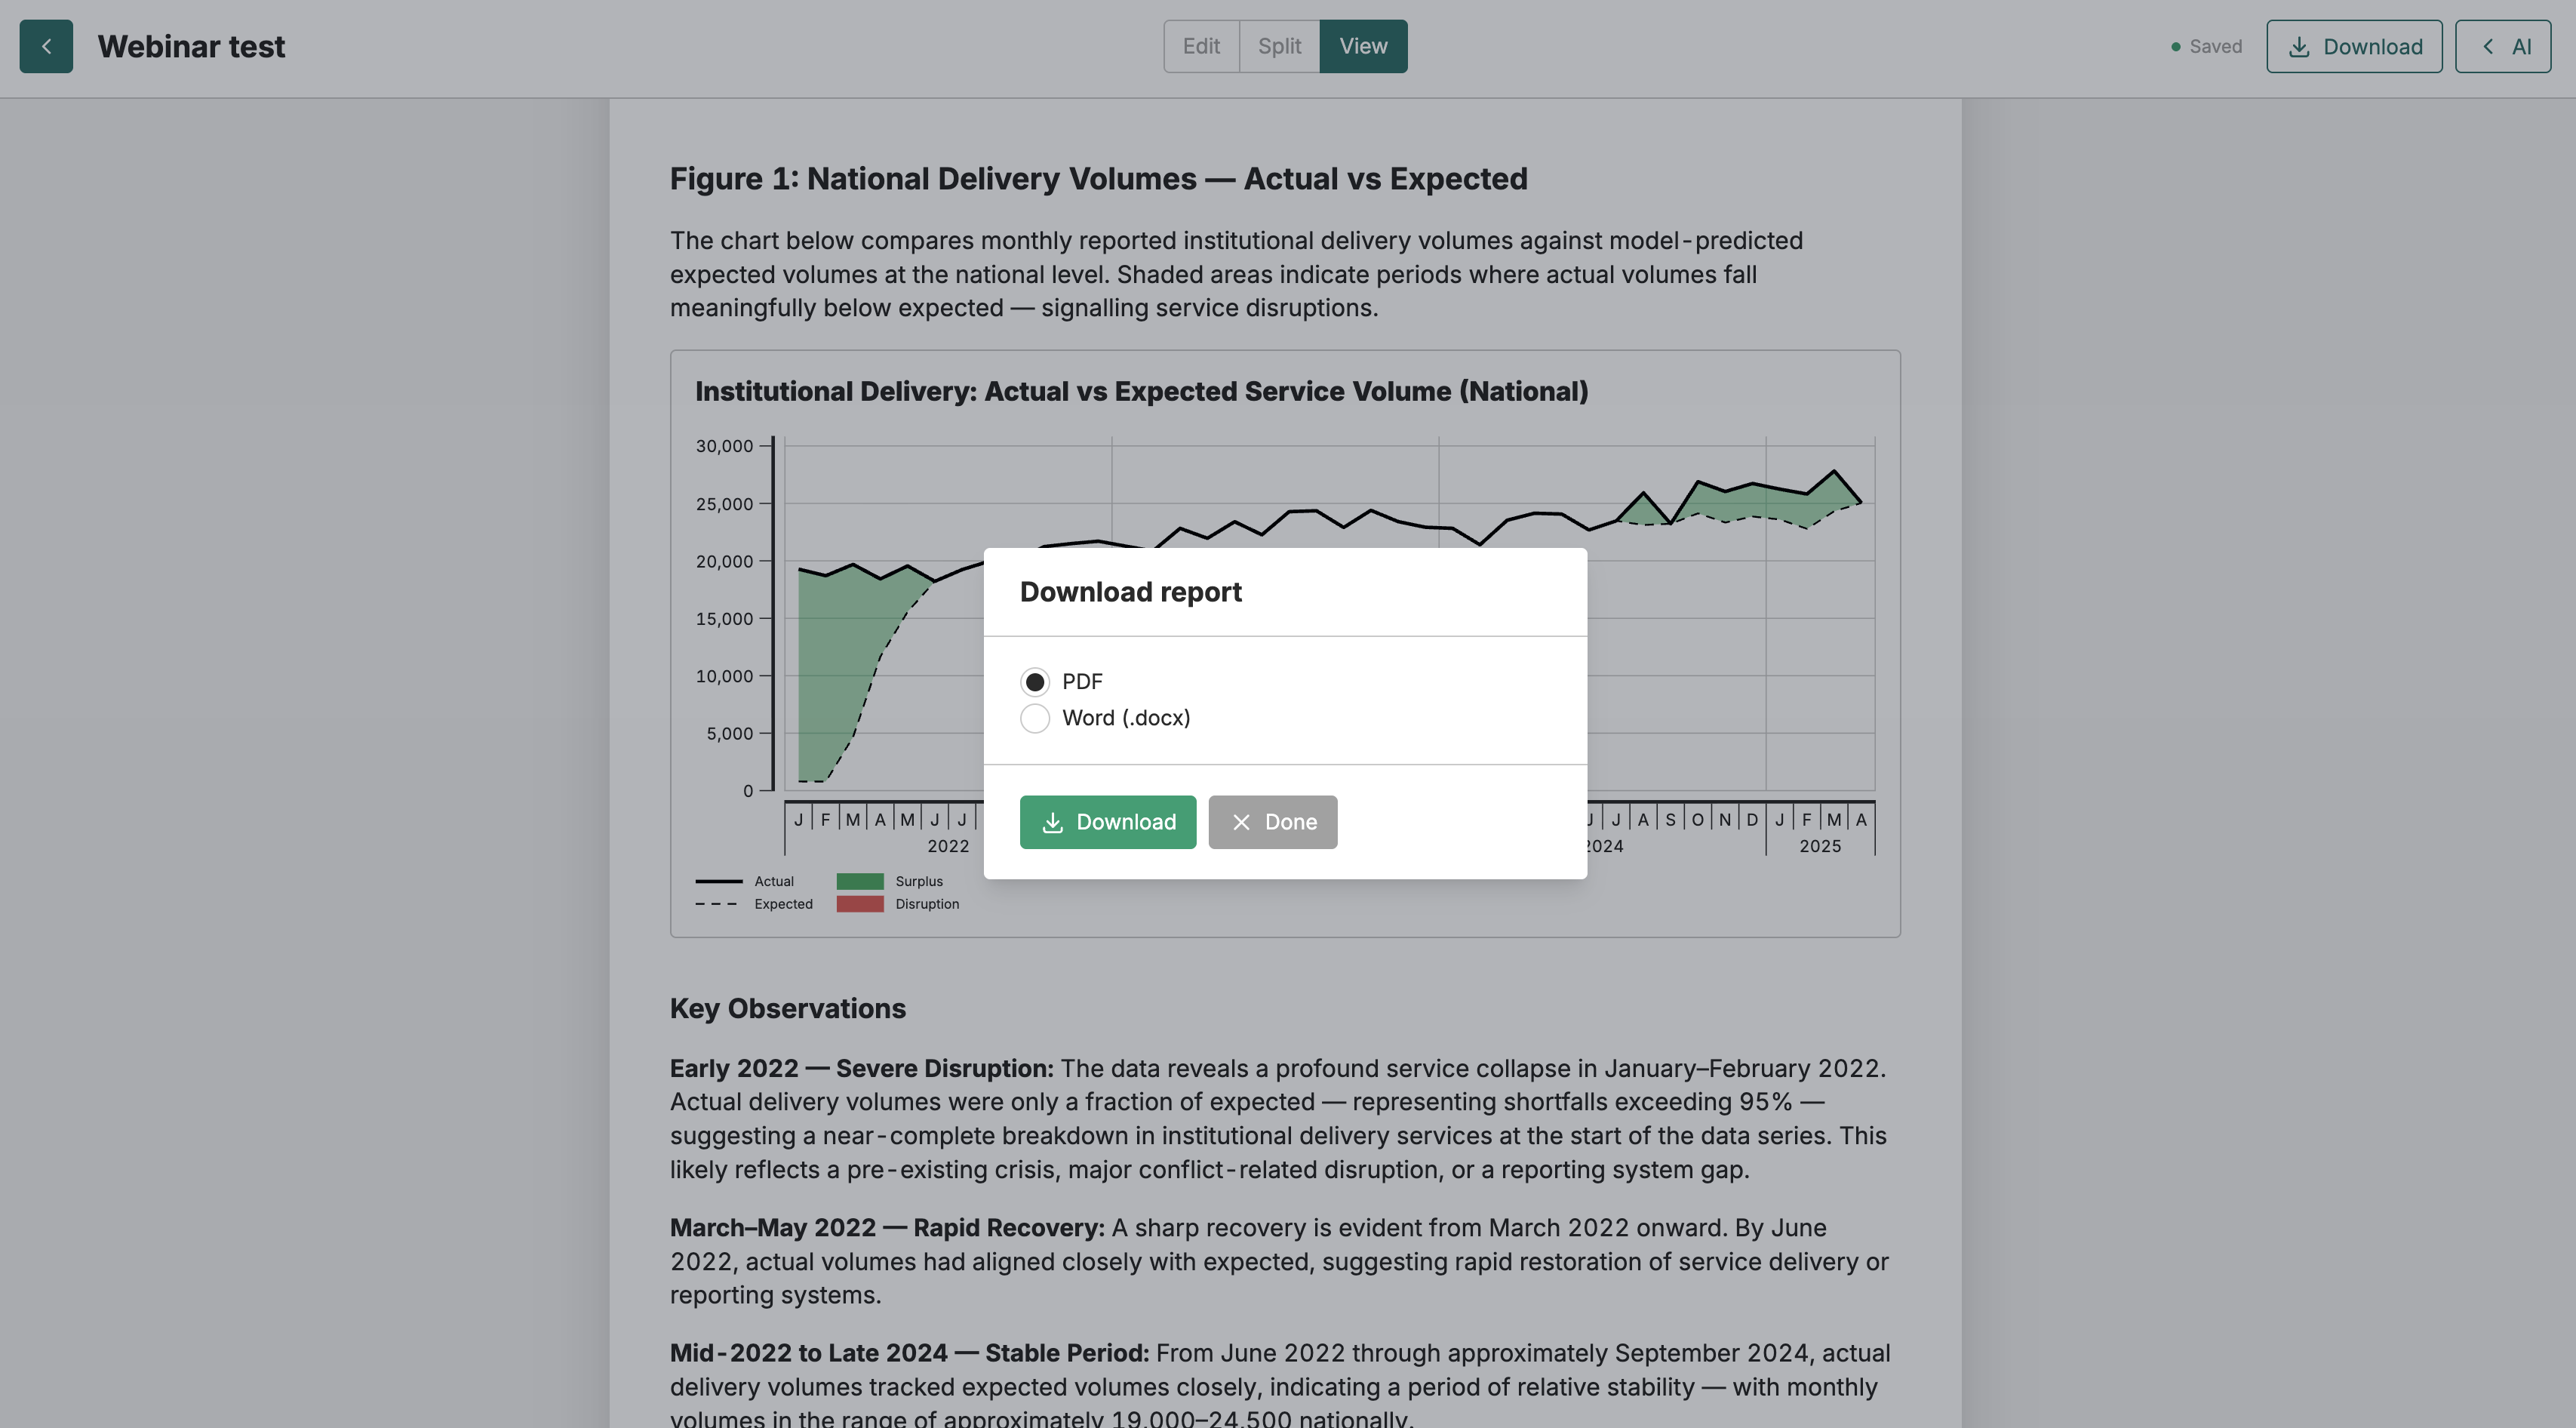
Section titled “Exporting”Click Download and choose PDF or Word (.docx). PDF is best for a final, fixed document you’re distributing or archiving; Word is best when a colleague needs to edit or comment. Both use consistent heading styles, so headings and structure carry over cleanly into the exported file. Live figures are rendered into the document at export time.
Common issues
Section titled “Common issues”A figure shows nothing or looks wrong: The visualization behind it has no data for the current window, or its configuration needs a change. Select the figure and use Edit visualization - see Visualizations.
The status says “Save failed”: A save didn’t reach the server, usually a connection issue. Stay on the page, check your connection, and keep editing - FASTR retries; don’t close the tab until you see Saved.
The exported file doesn’t match what I see: Export renders the current saved version. Make sure the header shows Saved, then download again.
Restore says saving must recover first: If the report has live edits that are currently failing to save, the safety version cannot be created until saving resumes. Wait for the Not saving indicator to clear, then retry the restore.