The FASTR data analytics platform
Overview
Section titled “Overview”The FASTR analytics platform is a web-based tool designed to support data quality assessment, adjustment, and analysis for routine health data. It allows users to upload and analyze data from various sources, including DHIS2, with built-in statistical methods to generate an adjusted dataset and run priority analyses on selected indicators. The platform provides a user-friendly interface for running analyses and offers flexible options for visualizing and exporting results.
Key capabilities
Section titled “Key capabilities”Data management
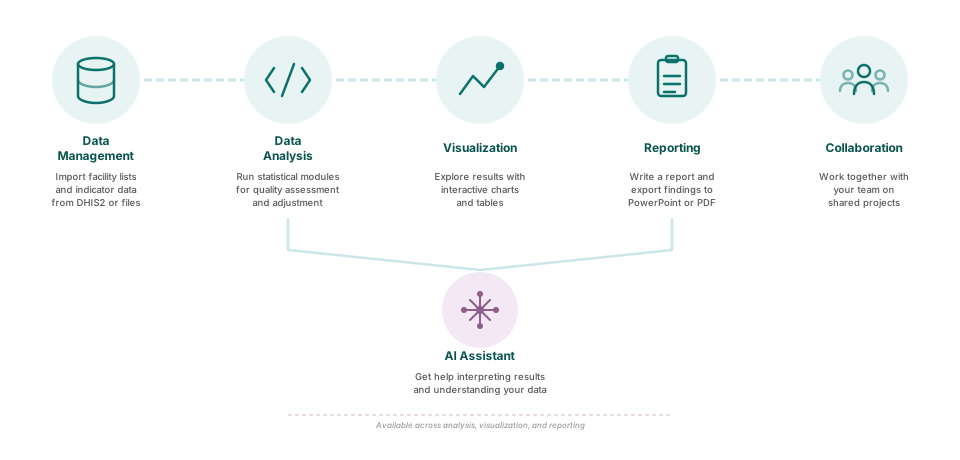
Section titled “Data management”The platform provides comprehensive data management functionality. Users can import and manage health facility structures, including administrative areas and individual facilities. The system supports data imports from Health Management Information Systems (HMIS) and Health Facility Assessments (HFA), enabling users to manage indicators from multiple sources while tracking dataset versions over time.
Data analysis
Section titled “Data analysis”Analytical capabilities are delivered through configurable modules. Users can enable and configure analytical modules that process data using R-based statistical scripts. These modules can be chained together to support complex, multi-step analyses, with built-in tools for monitoring processing status and reviewing logs.
AI assistant
Section titled “AI assistant”An integrated AI assistant helps users understand and interpret their data. The assistant can explain module outputs, describe data trends and patterns, provide insights about visualizations, and help generate narrative content for reports. Users can ask questions about their project data in natural language and receive contextual guidance on analysis and interpretation.
Visualization
Section titled “Visualization”The platform offers robust visualization tools for presenting analytical results. Users can create charts, maps, and tables from processed data, with options to filter and disaggregate by multiple dimensions. Visualizations can be customized in terms of appearance and styling, and exported as images or data files for use in external applications.
Reporting
Section titled “Reporting”Reporting functionality enables users to combine multiple visualizations into comprehensive reports. Reports can be exported as PowerPoint presentations or PDF documents. Users can organize and reorder report pages to meet specific communication needs and share completed reports with stakeholders.
Collaboration
Section titled “Collaboration”The platform supports collaborative work through a project-based structure. Users can organize their work into discrete projects and assign team members with different roles, including viewer, editor, and administrator permissions. Access controls operate at the project level, and projects can be locked to prevent unintended changes.
Who should use this application?
Section titled “Who should use this application?”Data analysts
Section titled “Data analysts”Data analysts will find the platform valuable for analyzing health data trends, creating visualizations, and generating reports for decision-makers. The analytical modules and visualization tools are designed to support rigorous data analysis workflows.
Health program managers
Section titled “Health program managers”Health program managers can use the platform to monitor program performance, track key indicators, and share insights with their teams. The reporting functionality enables regular communication of results to support evidence-based program management.
System administrators
Section titled “System administrators”System administrators are responsible for setting up the platform, managing users, importing data, and configuring the system to meet organizational needs. Administrative tools provide control over user access, data sources, and platform settings.
How the application works
Section titled “How the application works”Organization level (instance)
Section titled “Organization level (instance)”The instance serves as the organization’s primary workspace within the platform. Each instance contains all registered users, the shared administrative structure (including administrative areas and health facilities), shared indicator definitions, data sources (both HMIS and HFA), and all projects created within the organization.
Project level
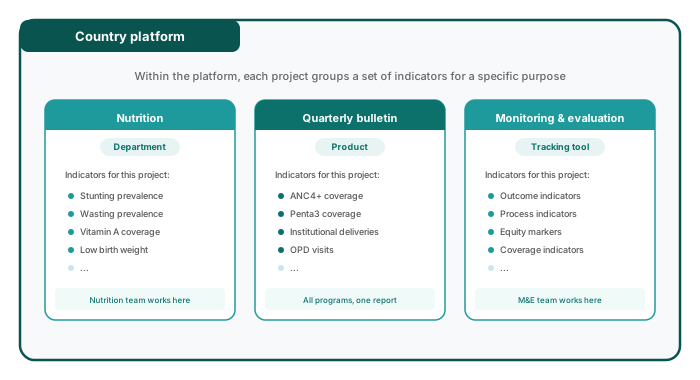
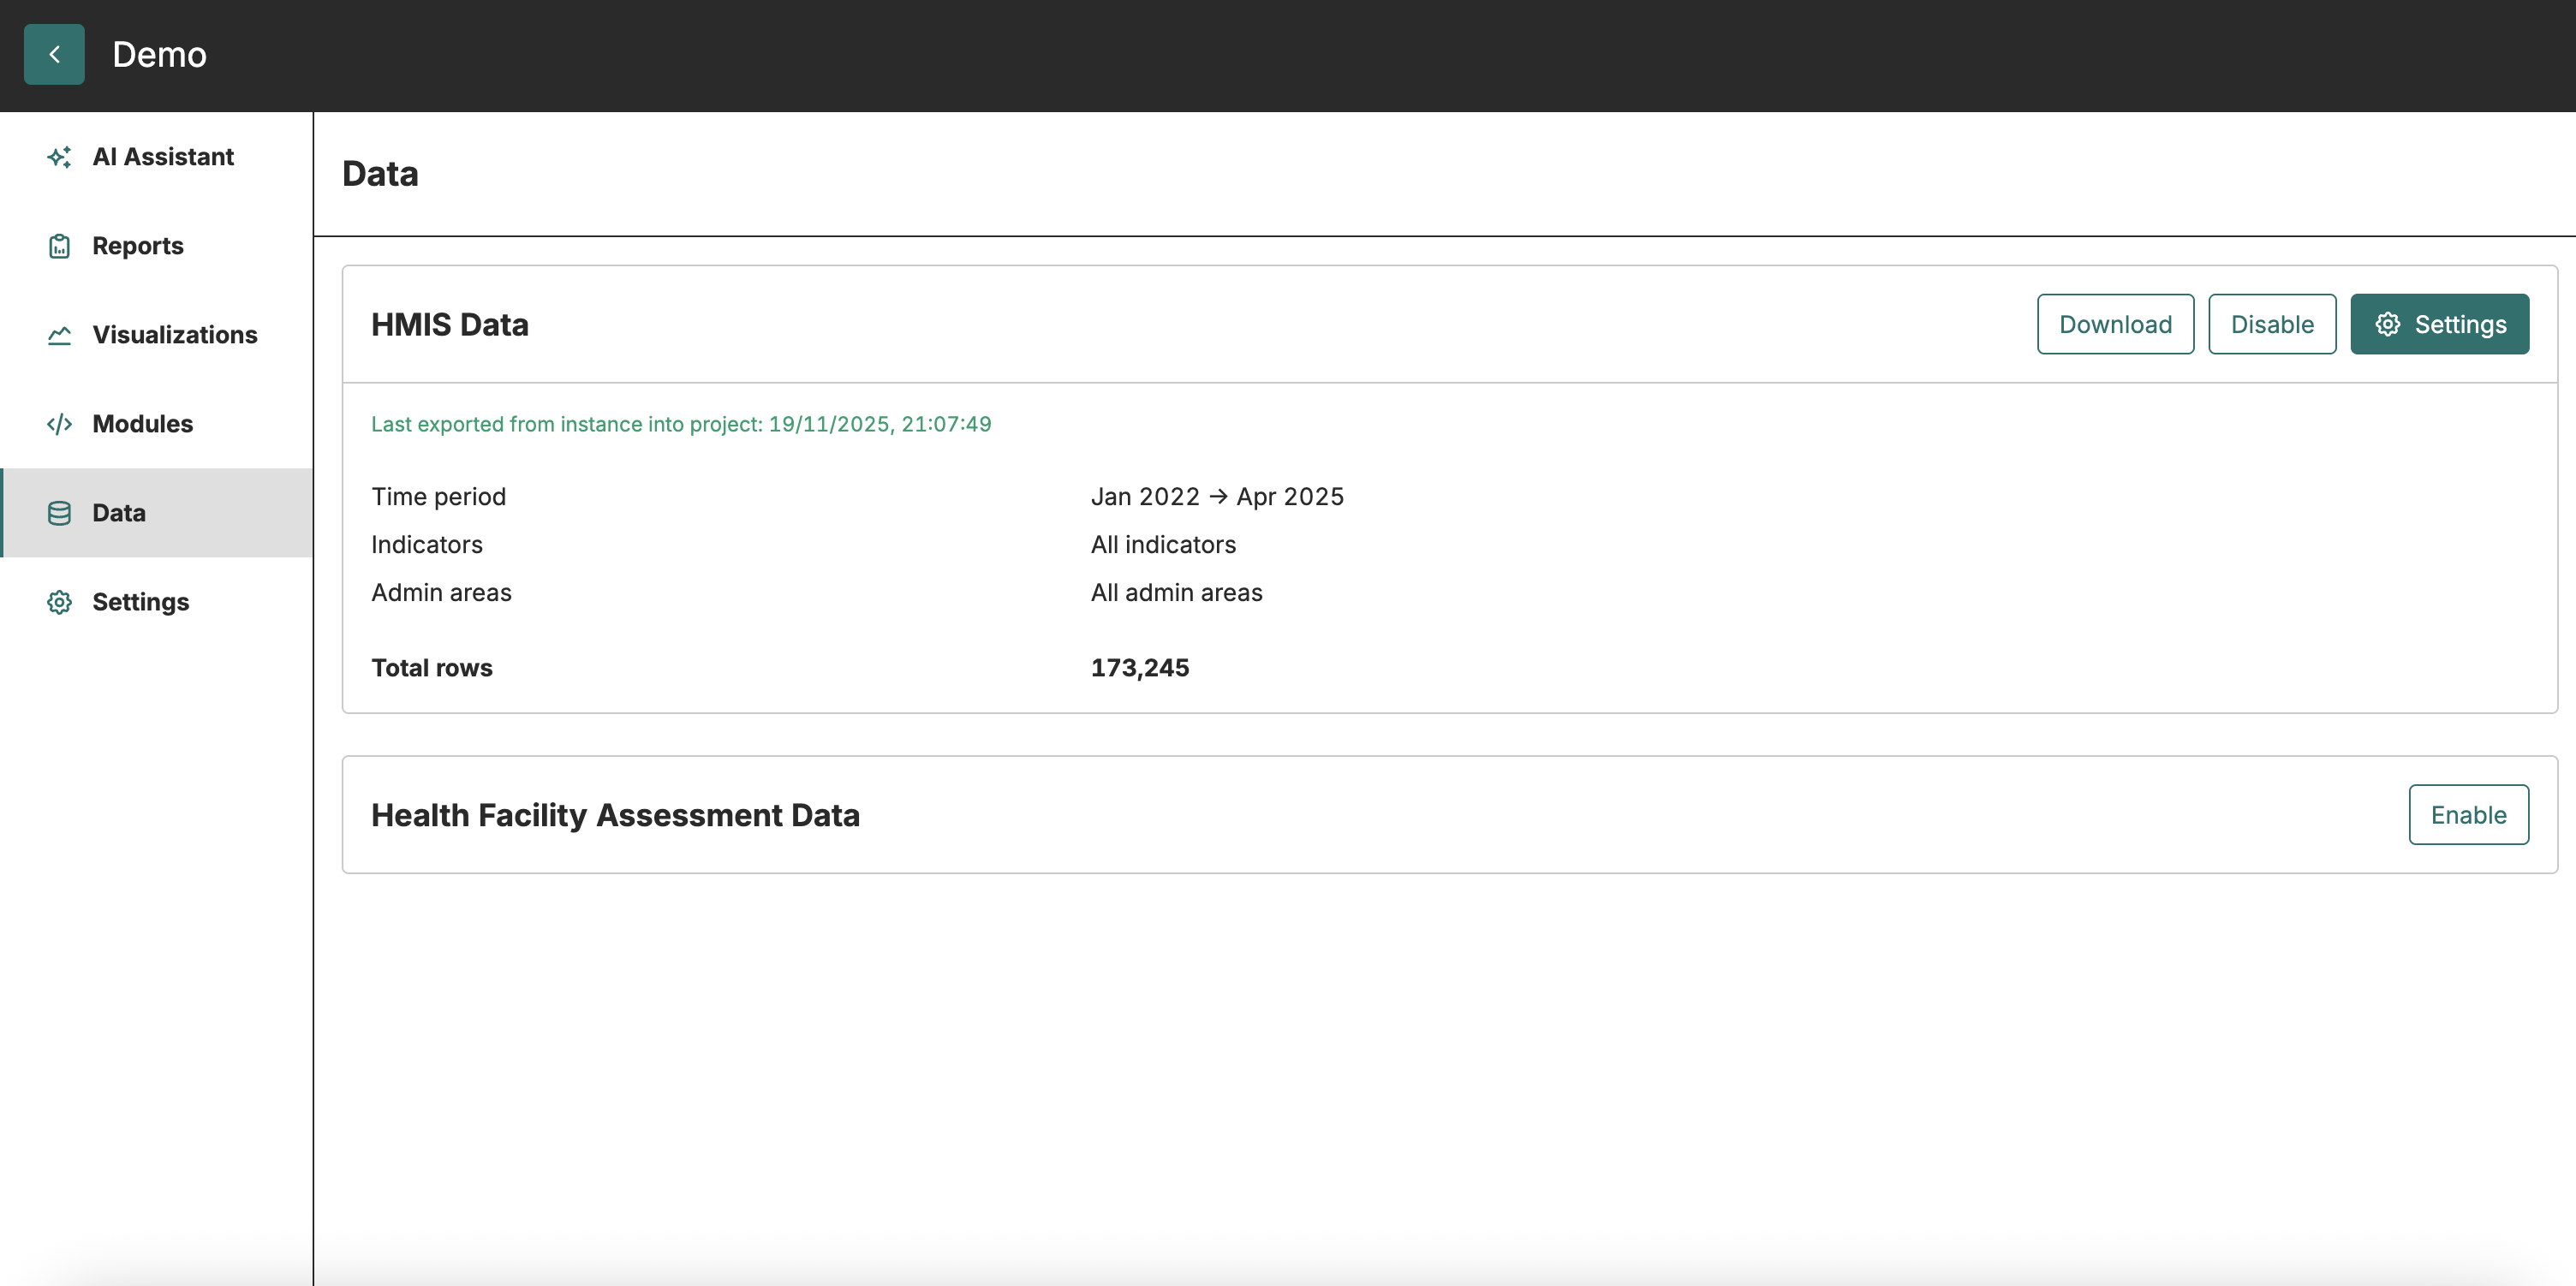
Section titled “Project level”Projects provide focused analysis workspaces within an instance. Each project allows users to select which data to include by defining specific time periods, facilities, and indicators. Within a project, users can enable analytical modules, create visualizations, and build reports tailored to specific analytical objectives.
Data flow
Section titled “Data flow”The platform follows a structured data flow: Data Import → Module Processing → Visualizations → Reports. Users first upload health facility data at the instance level. Projects are then created with specific data windows that define the scope of analysis. Analytical modules process and analyze the selected data, producing outputs that can be used to create charts, maps, and tables. Finally, visualizations are combined into exportable reports for dissemination.
Technical requirements
Section titled “Technical requirements”Supported languages
Section titled “Supported languages”The application currently supports English and French. Language settings can be configured at the instance level to meet the needs of different user communities.
Browser requirements
Section titled “Browser requirements”The application is designed to work with modern web browsers. Chrome is recommended for optimal performance, though Firefox, Safari, and Edge are also supported. JavaScript must be enabled for full functionality.
Basic concepts
Section titled “Basic concepts”Understanding these core concepts will help users work effectively with the application.
Instance
Section titled “Instance”An instance is the organization’s primary workspace within the platform. It serves as the top-level container for all users, the shared administrative structure, data sources, and projects. Each organization typically operates within a single instance that provides the foundation for all analytical work.
Projects
Section titled “Projects”A project is a focused analysis workspace within an instance. Projects enable users to work with specific subsets of data by defining time periods, facilities, and indicators relevant to a particular analytical objective. Within each project, users can enable analytical modules, create visualizations, generate reports, and collaborate with team members. Multiple projects can exist within one instance, each with different data scopes and user access configurations.
Structure
Section titled “Structure”The structure defines the hierarchical organization of administrative areas and health facilities within the platform.
Administrative areas represent geographic boundaries organized in up to four levels. Admin Area 1 represents the country boundaries. Admin Area 2 corresponds to the largest subnational units such as provinces or regions. Admin Area 3 encompasses mid-level units like districts or departments, while Admin Area 4 represents smaller units such as communes or sub-districts. Not all instances require all four administrative levels.
Health facilities are the healthcare service delivery points—including hospitals, clinics, and health posts—that are linked to administrative areas within the structure. Facilities may have additional attributes such as facility type (hospital, health center, or dispensary) and ownership category (public, private, or faith-based).
Data sources
Section titled “Data sources”HMIS data
Section titled “HMIS data”Health Management Information System (HMIS) data contains routine health service statistics collected from facilities. This includes service delivery indicators, disease surveillance data, and program performance metrics. HMIS data is typically reported on a monthly basis and forms the foundation for most routine health system analyses.
HFA data
Section titled “HFA data”Health Facility Assessment (HFA) data contains information about facility characteristics and capacity. This includes data on infrastructure availability, equipment and supplies, staffing levels, and service readiness. HFA data complements HMIS data by providing context about the facilities from which routine data is reported.
Indicators
Section titled “Indicators”Indicators are measurable health metrics used within the platform. These can be either Common Indicators, which are defined and shared across the instance for consistent measurement, or DHIS2 Indicators, which are imported from external DHIS2 systems and may follow different naming conventions or calculation methods.
Datasets and versions
Section titled “Datasets and versions”A dataset is a collection of health data, either HMIS or HFA. Each time data is imported into the platform, a new version is created. This versioning system allows users to track changes over time, switch between versions if needed, and maintain a complete data history for audit and comparison purposes.
Modules
Section titled “Modules”Modules are data processing units that execute analytical R scripts within the platform. Each module takes input data from datasets or from the outputs of other modules, processes and analyzes the data according to defined statistical methods, and produces results objects as output files. Modules can be chained together to support complex analytical workflows where one module uses another’s outputs as its inputs.
The platform distinguishes between two module types. A Module Definition is the template or blueprint for a type of analysis, defining the analytical methods and parameters available. A Module Instance is a module that has been enabled and configured within a specific project. Some modules have prerequisites, meaning that other modules must be enabled first before they can be used.
Visualizations (presentation objects)
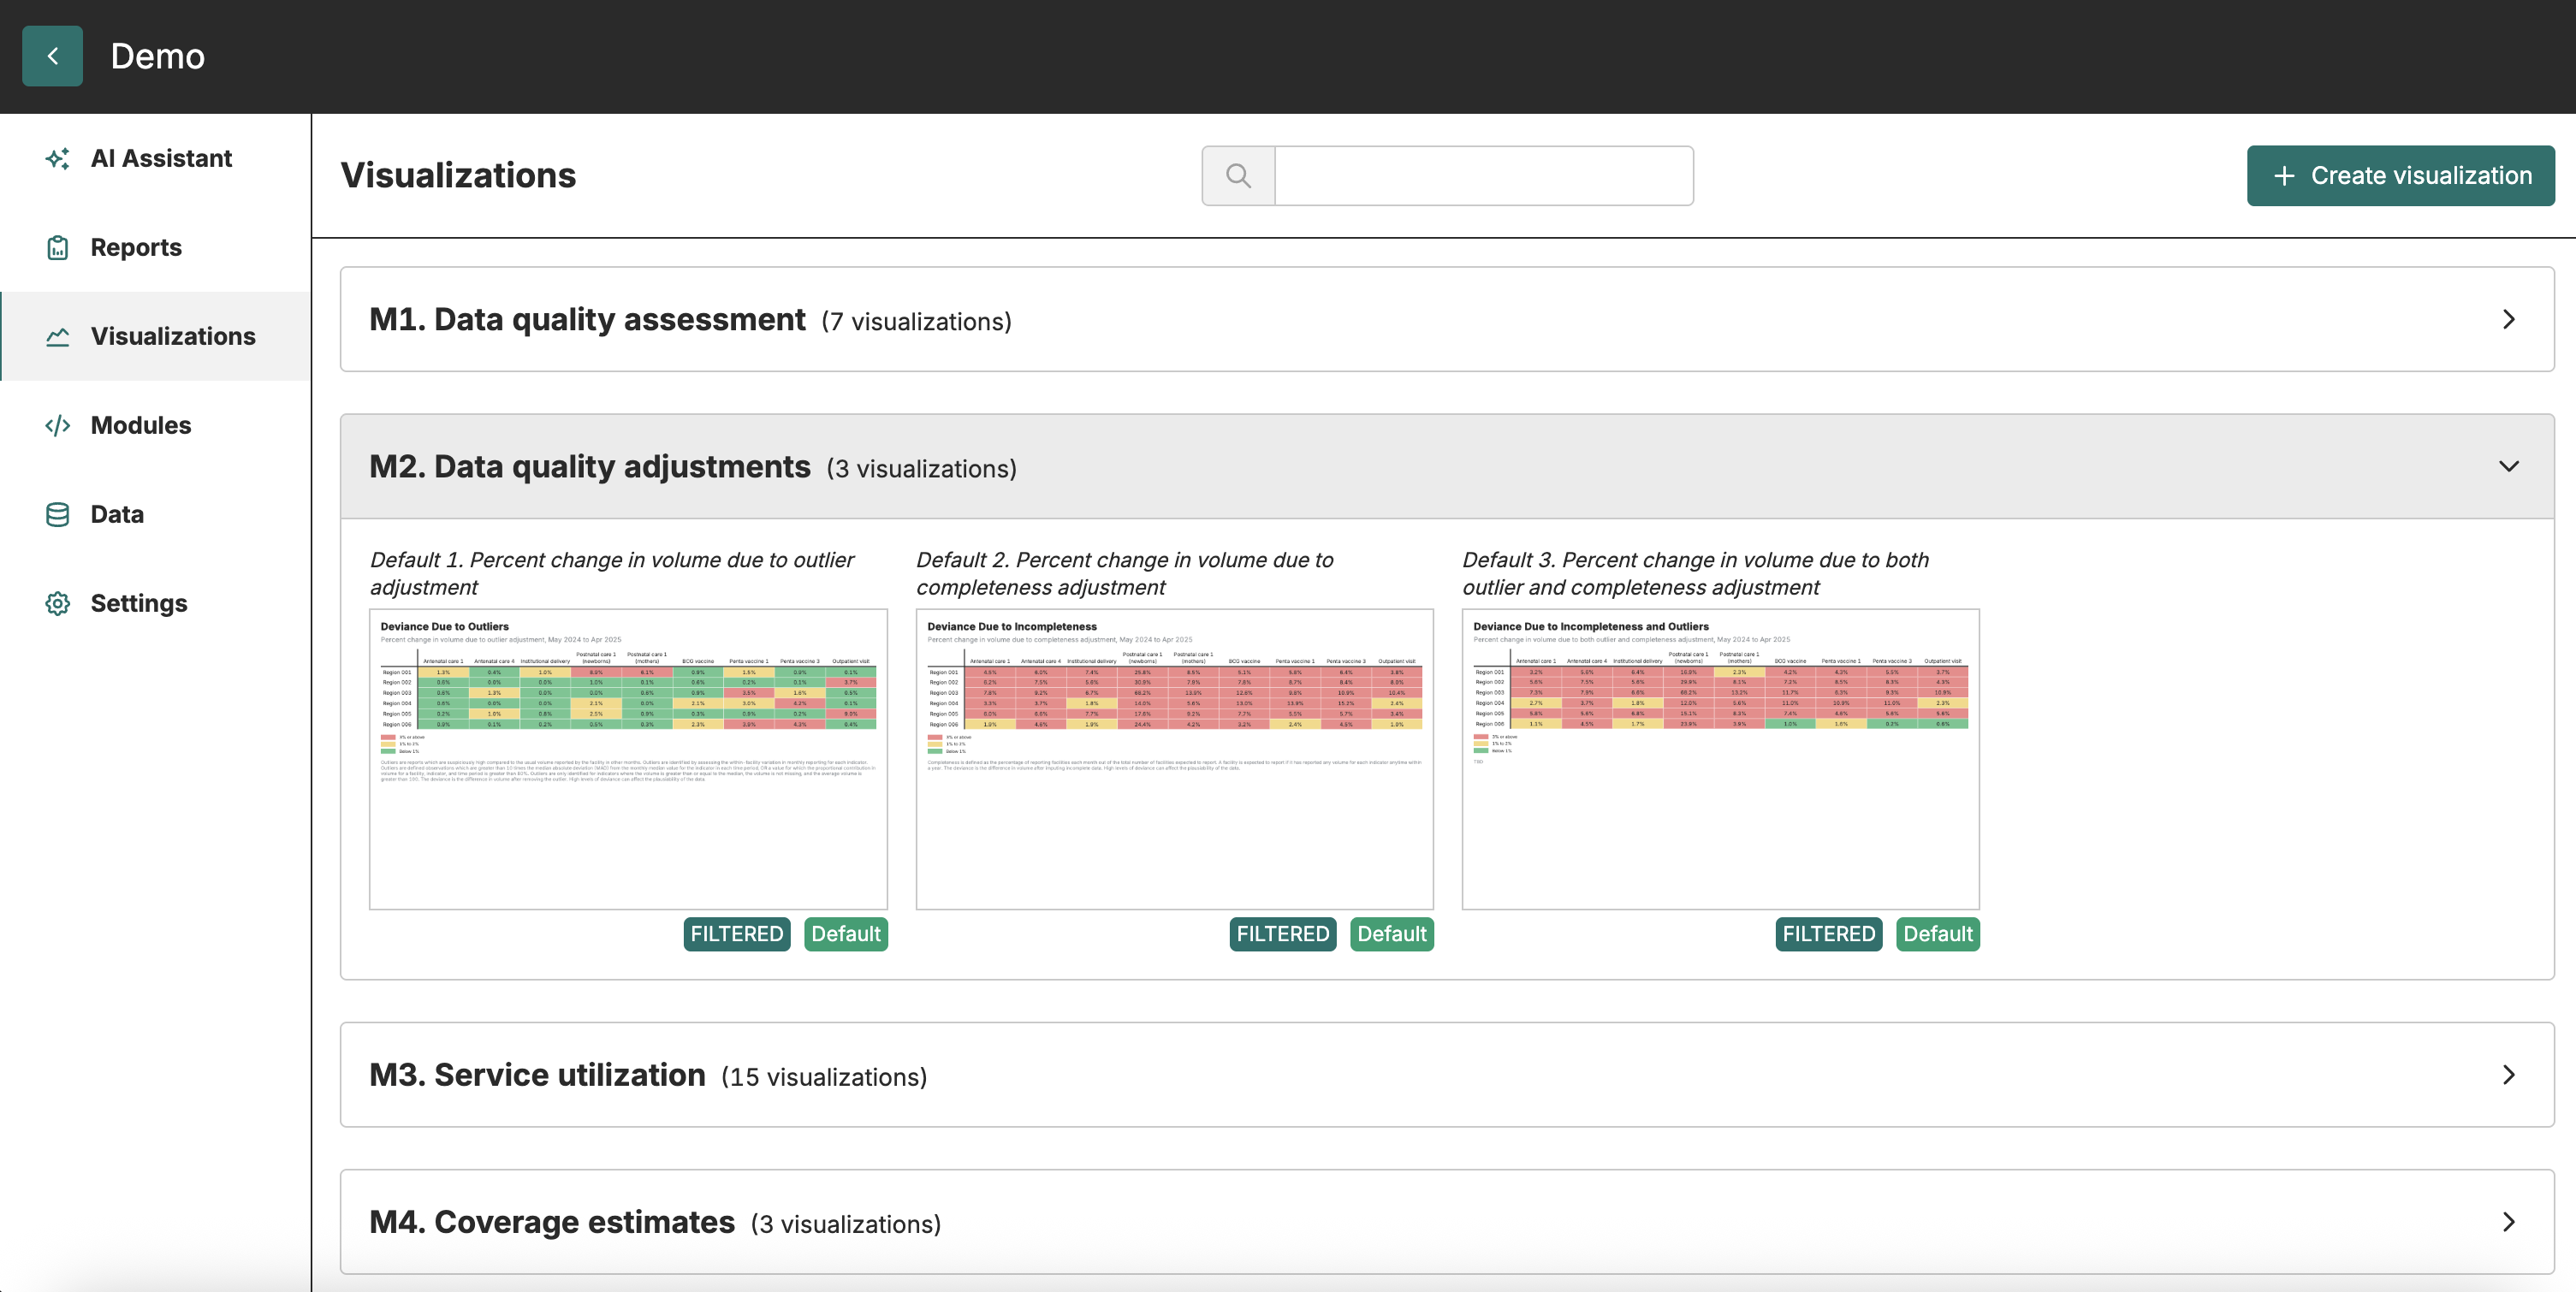
Section titled “Visualizations (presentation objects)”Visualizations, also referred to as presentation objects, are visual representations of data generated from module outputs. The platform supports three main visualization types: charts (including bar charts, line graphs, and pie charts), maps (geographic visualizations showing data across administrative areas), and tables (tabular data displays).
Visualizations can be filtered by various dimensions and disaggregated by factors such as facility type, time period, or administrative level. Users can customize the appearance and styling of visualizations, and export them for use in external applications or include them directly in reports.
Reports
Section titled “Reports”Reports are collections of visualization pages designed for export and sharing with stakeholders. Reports can be exported as PowerPoint presentations or PDF documents, and can be organized with multiple pages configured with custom layouts and orientations. Each page in a report is a report item that contains a visualization.
Windowing
Section titled “Windowing”Windowing refers to the process of selecting a subset of instance data for use within a project. Users can filter data by time period (selecting specific months or years), by indicators (including all or only specific indicators), by administrative areas (including all or specific regions), and by facilities (filtering by facility type or ownership). This functionality allows projects to focus on the data most relevant to their analytical objectives without loading the entire dataset.
Disaggregation
Section titled “Disaggregation”Disaggregation refers to the process of breaking down data by dimensions to identify patterns and variations. Data can be disaggregated by time period (monthly, quarterly, or yearly), by administrative area level, by facility type, by facility ownership, or by indicator categories. This capability supports more nuanced analysis and helps identify disparities across different dimensions.
User roles
Section titled “User roles”Users can be assigned different roles that determine their permissions within the platform. At the instance level, Global Administrators have full access to all instance settings and projects. At the project level, three roles are available: Administrators can modify project settings, modules, visualizations, and reports; Editors can create and modify visualizations and reports; and Viewers can view project contents but cannot make modifications.
Data quality scores
Section titled “Data quality scores”The platform automatically assesses data completeness and accuracy, generating quality scores that help users identify potential data issues. These scores support data quality review processes and help prioritize areas requiring attention.
Lock status
Section titled “Lock status”Projects can be locked to prevent modifications to their configuration while still allowing users to view reports. When a project is locked, modules and data settings cannot be changed, providing a mechanism to preserve analytical configurations once they have been finalized.
!!! tip “User guide” For step-by-step tutorials on using the platform, see the FASTR user guide.
FASTR analytics platform
Section titled “FASTR analytics platform”The FASTR analytics platform is a web-based tool designed to support data quality assessment, adjustment, and analysis for routine health data.
It allows users to upload and analyze data from various sources, including DHIS2, with built-in statistical methods to generate an adjusted dataset and run priority analyses on selected indicators.
The platform provides a user-friendly interface for running analyses and offers flexible options for visualizing and exporting results.
Platform capabilities
Section titled “Platform capabilities”
Data Management — Import facility lists and indicator data from DHIS2 or files
Data Analysis — Run statistical modules for quality assessment and adjustment
Visualization — Explore results with interactive charts and tables
Reporting — Export findings to PowerPoint or PDF for stakeholders
Collaboration — Work together with your team on shared projects
AI Assistant — Get help interpreting results and understanding your data
Country Instance
Section titled “Country Instance”Each country has its own instance of the FASTR analytics platform.
An instance contains:
- All registered users and their accounts
- The shared administrative structure (regions, districts, facilities)
- Indicator definitions and data sources
- All projects created for that country
Think of an instance as your country’s dedicated workspace.
User Roles and Permissions
Section titled “User Roles and Permissions”There are two levels of permissions in the platform:
Instance-level roles:
- Instance Administrators can add users, create projects, assign roles, upload data, import and configure modules, and run analyses
Project-level roles:
- Project Editors can create visualizations, create reports, and download/export results
- Project Viewers can view visualizations, view reports, and download/export results
Administrators are assigned per instance; Editors and Viewers are assigned per project.
Projects Within an Instance
Section titled “Projects Within an Instance”
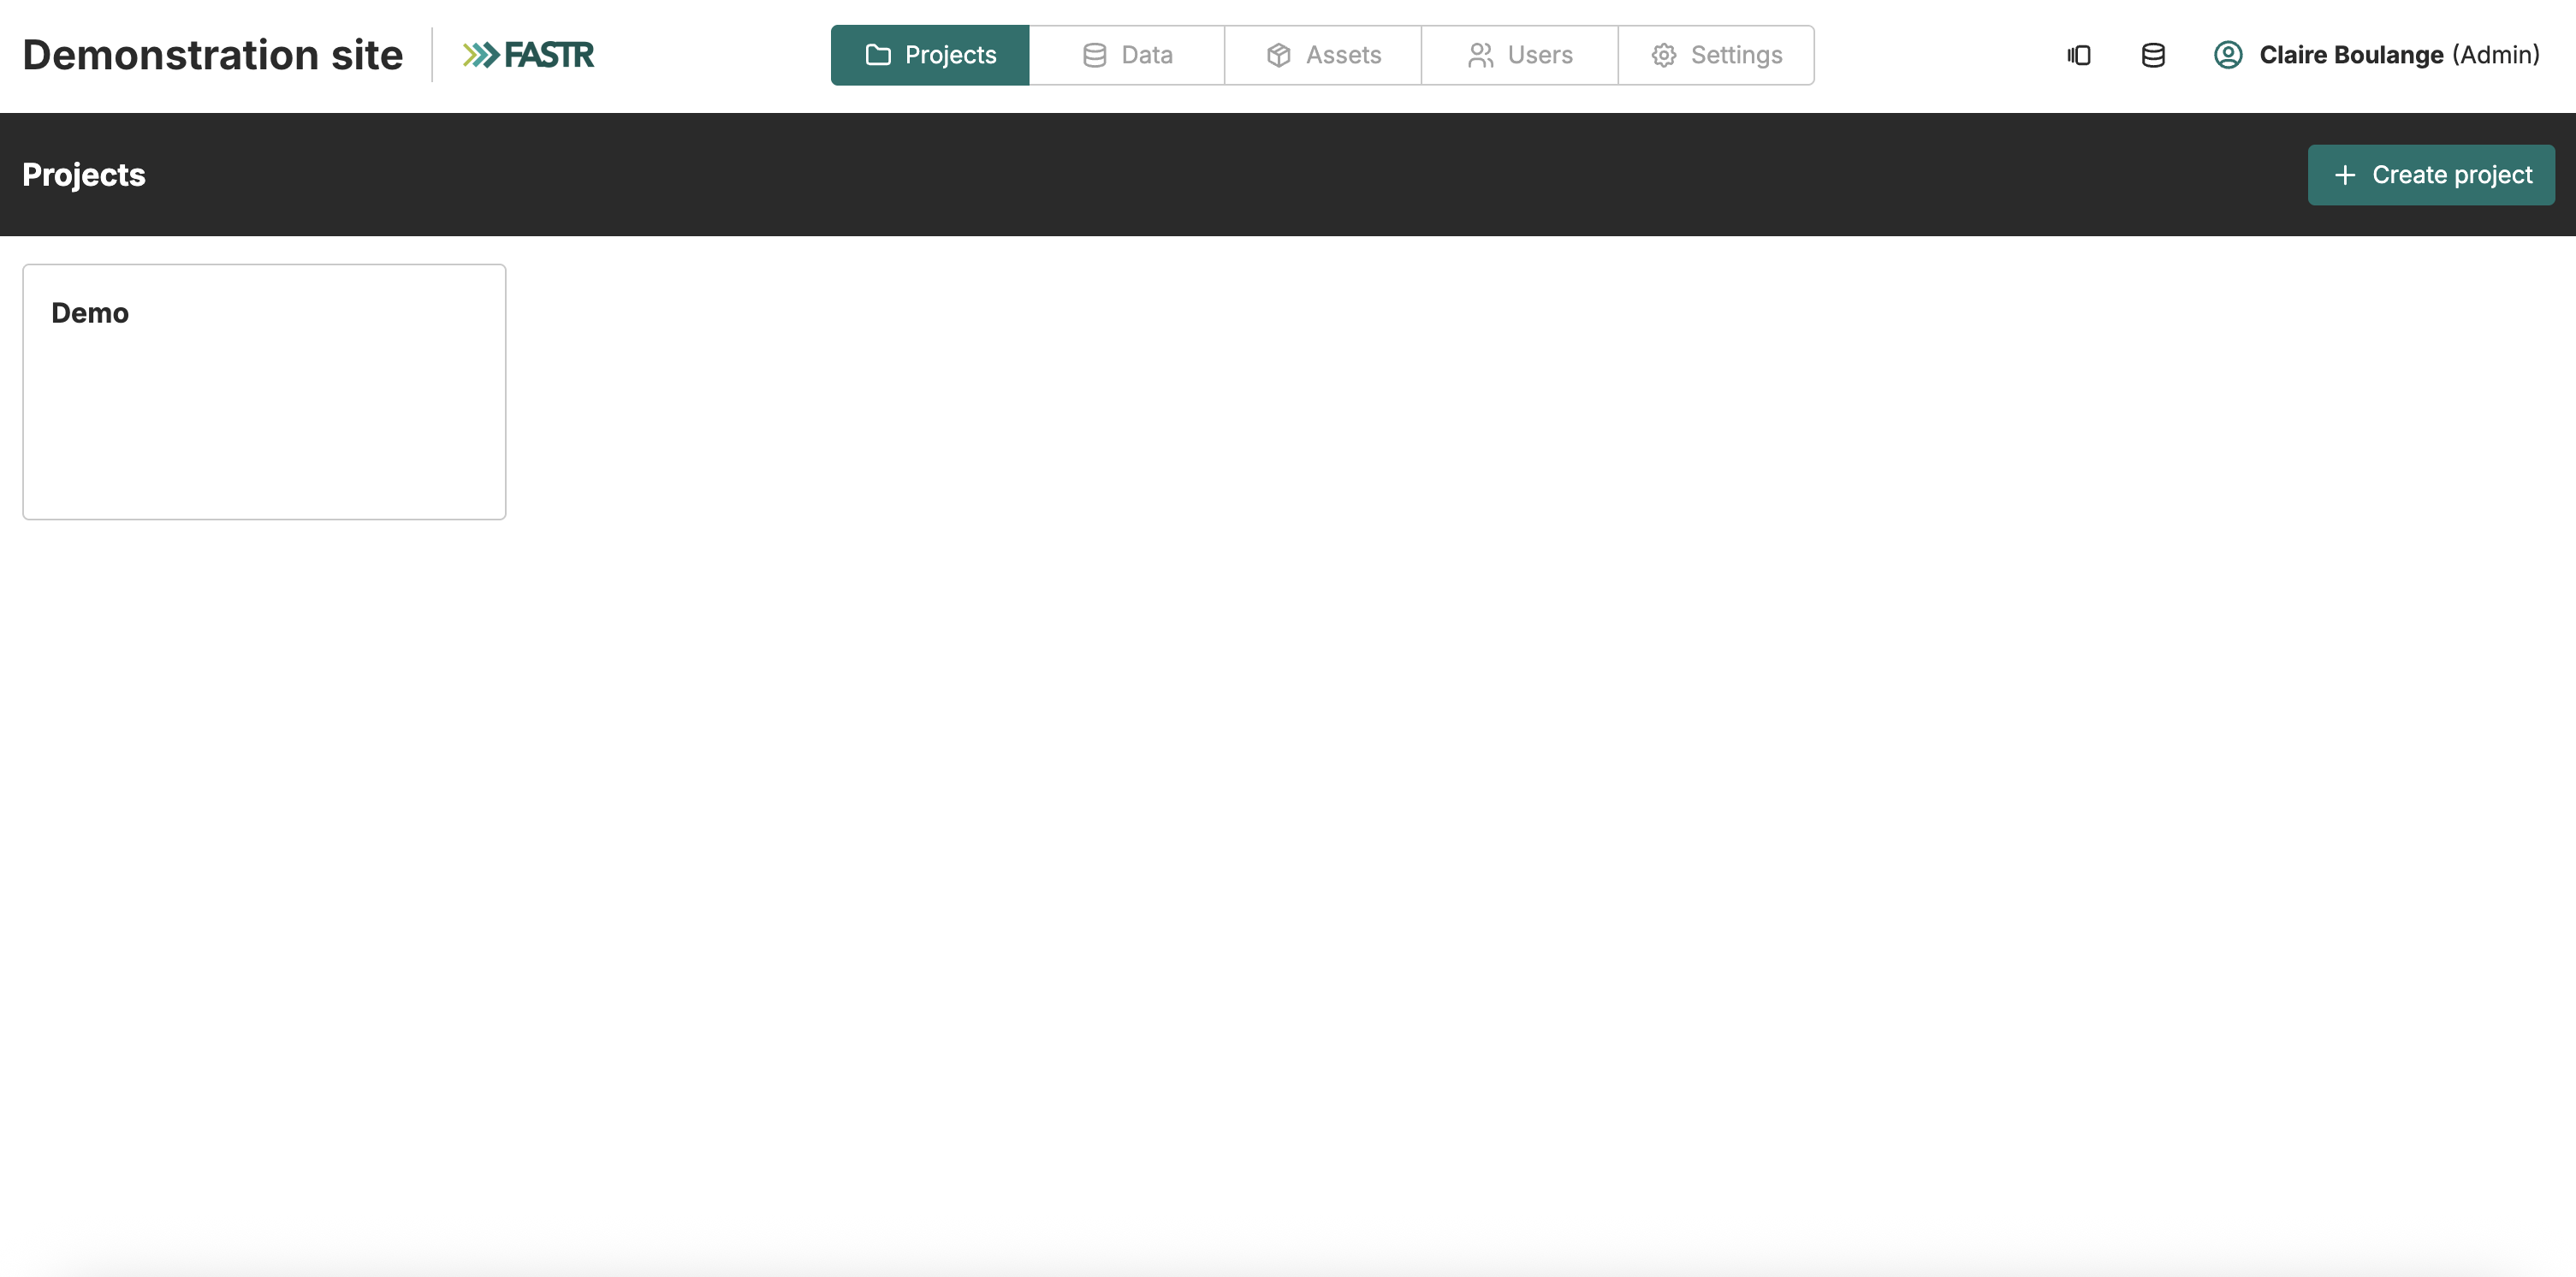
Each country instance can contain multiple projects.
A country may only need one project, or multiple projects can be used for:
- Different versions of analyses
- A demo or playground project
- Separate projects for different teams or programs
Key questions when setting up:
- Who is the admin?
- Who can edit?
- Who can view?
Configuring the analysis platform
Section titled “Configuring the analysis platform”-
Configuration of the analysis platform is an admin feature
-
We will work together to configure the following items:
- Admin areas (regions, districts)
- Facility structure
- Indicator definitions
-
Note since this is an admin feature all participants will NOT be doing this step. Instead, you will select one person to have admin rights, and they will help us walk through these steps.
Contact: fastr@worldbank.org
What you’ll learn
Section titled “What you’ll learn”In this module, you will learn about:
- What the FASTR analytics platform is and what it can do
- How the platform is organized — instances, projects, and user roles
- Who does what — the difference between administrators, editors, and viewers
- How the platform is configured for your country
After this overview, you’ll get hands-on practice in the Getting started activity.
Getting started with the platform
Section titled “Getting started with the platform”Now that you understand how the platform is organized, you’ll get hands-on experience in the Getting started activity module.
You will:
- Log in to your country’s FASTR instance
- Navigate the interface — projects, modules, and visualizations
- Explore a sample project to see how data, analyses, and reports fit together
Your facilitator will guide you through each step.
Platform roadmap
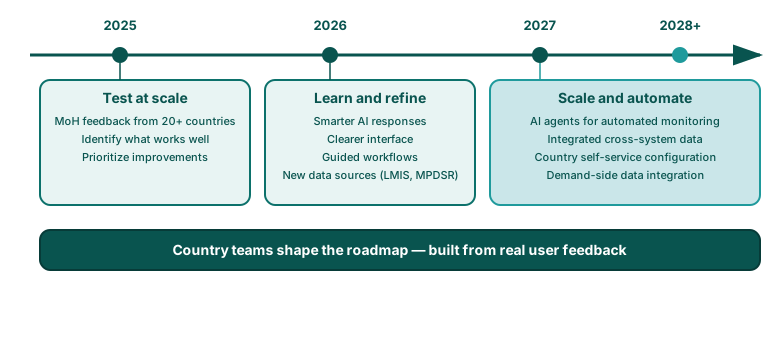
Section titled “Platform roadmap”